Performance-Driven Design of Multi-Stage Gear Transmissions for E-Drive Systems
The electrification process involving urban mobility vehicles is pushing research into developing efficient and durable transmissions. The transmission system has the crucial role of transforming the electrical energy produced by the electric machine into mechanical power, which is subsequently delivered to the wheels through a gear reduction system. For this reason, in recent years, the development of predictive models for analyzing efficiency losses in gear transmissions has been one of the most discussed topics by scientists (Refs. 1, 2). Among the several architectures proposed, thanks to their versatility, multi-stage transmission systems represent one of the most adopted solutions, both because they allow motion to be transferred between distant axes and because they allow high gear ratios to be achieved, reducing the effects of excessive sliding, which inevitably leads to loss of efficiency and premature wear. However, the design of multi-stage transmission systems, especially in the preliminary stages of the project where little data is available, is complex and often driven by trial-and-error procedures. Optimization methods have recently been adopted to provide reliable solutions for single-stage gears to reduce mass and noise and improve efficiency (Refs. 3, 4). The results demonstrate how this approach can enhance the quality of transmission and reduce costs due to experiments. Recently, in existing literature, some techniques based on optimizing the multi-stage gear trains have been proposed (Refs. 5, 6, 7). Although Sundaresan et al. (Ref. 8) and Houser and Harianto (Ref. 9) notably consider manufacturing and geometric constraints at the early design stage, in most multi-stage transmission optimization studies, these aspects are simplified or addressed only in a preliminary filtering phase. However, effective gear design necessitates a thorough examination of the geometric-kinematic and the mechanical strength and efficiency aspects, which are closely interrelated. Both considerations are intricate and interconnected. To ensure the optimal performance of assembled drive gear systems, it is imperative to address them concurrently. In the present literature, the direct integration of manufacturing-related parameters (such as tooth interference reserve, tooth clearance, and tip thickness) into a macro-geometry multi-objective optimization framework for multi-stage systems remains less explored. This study directly tackles these challenges by introducing an innovative multi-objective optimization framework for designing multi-stage spur gear transmissions, explicitly integrating these constraints into the optimization process. The optimization strategy consists of two sequential phases: an in-depth characterization of the gear domain, defined by multiple macro-geometry parameters, followed by an optimization stage employing an elitist non-dominated sorting genetic algorithm (Ref. 10). To estimate both load-dependent and load-independent power losses, the methodology incorporates the KISSsoft (Ref. 11) power loss calculation, based on the Ohlendorf-Niemann formulation (Ref. 12), as well as the Anderson-Lowenthal (Ref. 13) model. Throughout the process, geometric, spatial, and dimensional constraints are strictly enforced, alongside safety requirements assessed through ISO standard safety factors (Ref. 14). As a result, the generated designs intrinsically satisfy dimensional requirements and manufacturing constraints, eliminating the need for post-optimization validation and ensuring enhanced performance. The proposed methodology is designed to be applicable to a wide range of gear transmission architectures. In this study, it is specifically applied to a two-stage transmission system, which is evaluated using two different layouts: one with a gear train that includes an idler and another with a counter-shaft arrangement consisting of four gears. For the two-stage application, the multi-objective optimization strategy was employed to define the Pareto front, a concept widely adopted in gear design optimization (Refs. 7, 15, 16) to evaluate trade-offs between conflicting objectives. The front is the locus of all the compromise (Pareto-optimal) solutions for which one cannot further improve one objective function without inevitably degrading the other one. In this context, it provides a clear framework for comparing design alternatives, enabling a comprehensive comparison of trade-offs between efficiency and weight. The final selection of the optimal design is ultimately the designer's responsibility. This decision can be assisted by various decision-making tools such as fuzzy logic, which is generically implemented to assess robustness and uncertainty (Ref. 17). The case study results reveal that the most efficient solutions in both configurations generally tend to exhibit a high tooth count, a small module, and wide face widths. In contrast, designs optimized for minimal weight are often associated with larger modules but more compact geometries. Moreover, the compound arrangement offers greater design flexibility, enabling smaller gear diameters and a more uniform distribution across the feasible design space and thus the Pareto front.
Methodology
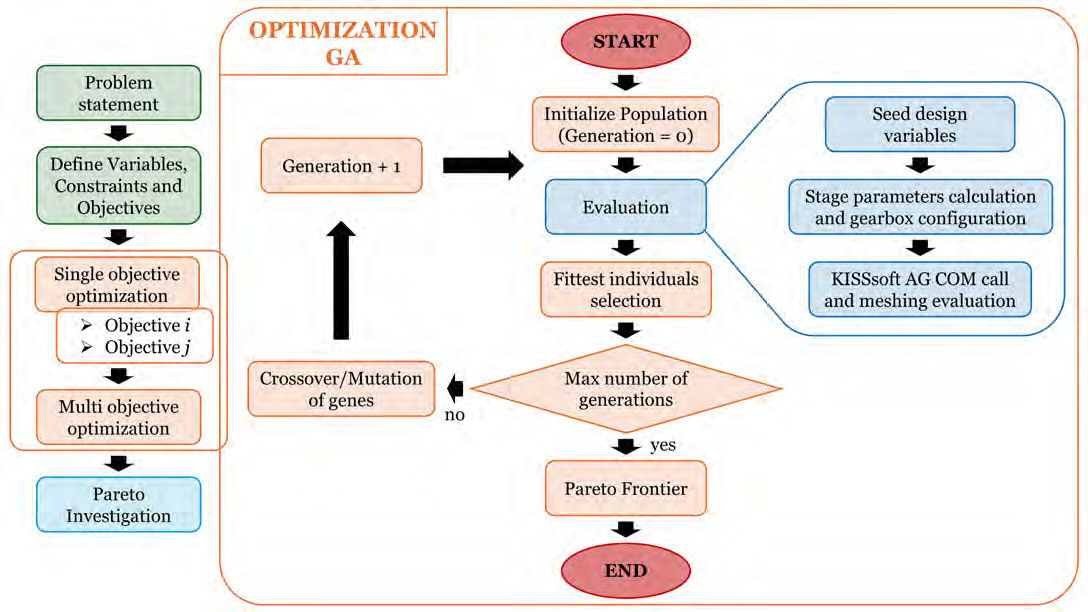
A design process typically involves a goal-oriented exploration within a defined search space, influenced by certain constraints and variable limits. While optimization algorithms can assist in this process by utilizing computational power to improve convergence toward an optimal solution, their effectiveness may be compromised if the problem is unclear. As a result, the process might converge quickly to a solution that is not optimal, or it could take too long to arrive at an adequate result. Therefore, the mathematical representation established through carefully selecting objectives, variables, and constraints, highlighted as the first stage (green) in the design optimization procedure shown in Figure 2, is crucial for the success of the design process.
Multi-Stage Gearbox Transmission System and Design Variables
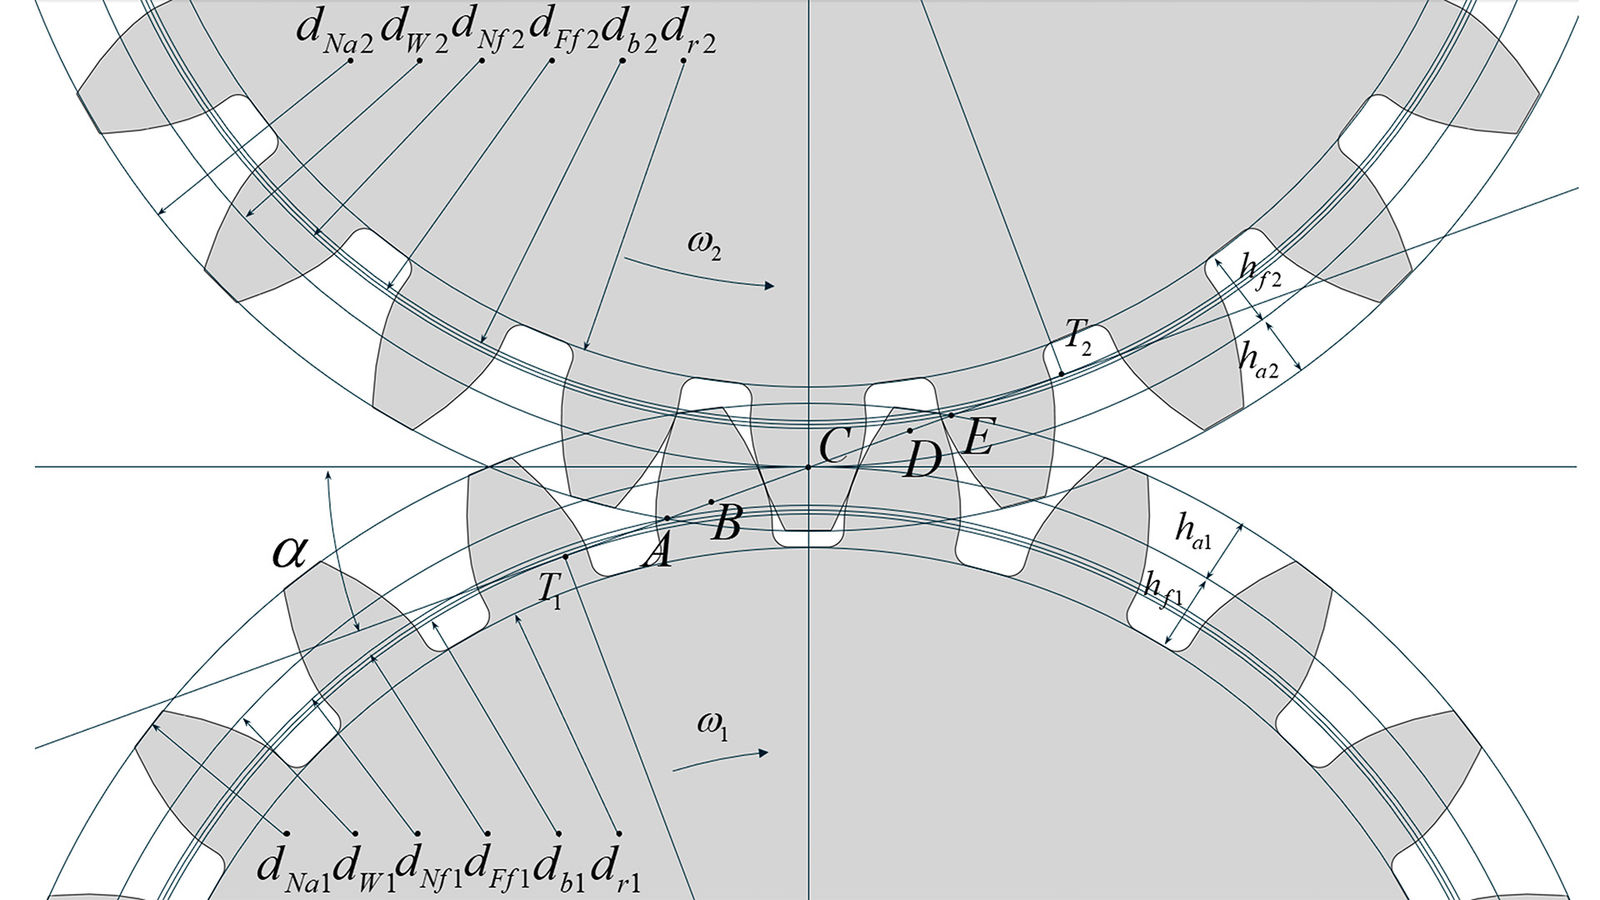
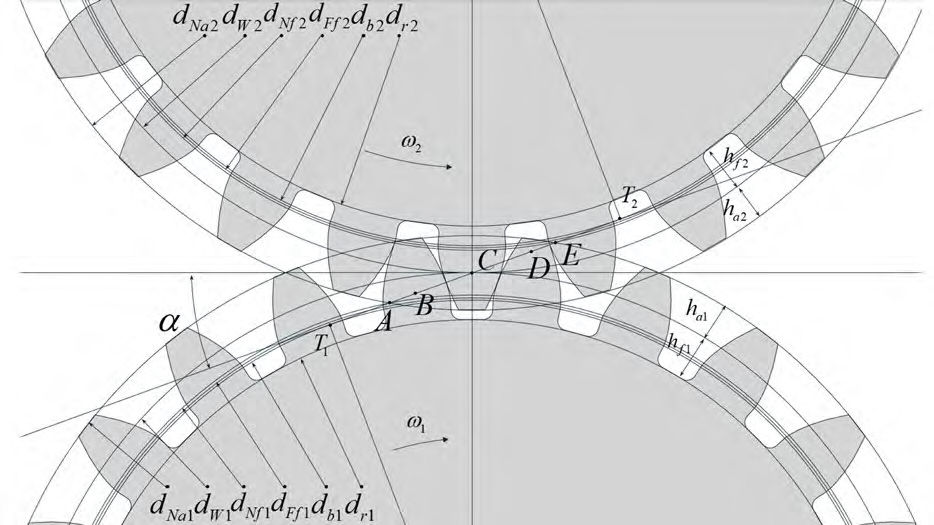
Gear trains are transmission systems generated by the serial connection of simple gear pairs. The architecture and the system's layout extremely influence the gear train's performance. However, even the macrogeometry of single gears plays a crucial role in power loss. For this reason, it is necessary to consider the geometrical entities of each stage gear at the optimization level, summarized in Figure 1.
Figure 1—Gears parameters.
According to ISO 21771 (Ref. 18), each involute spur gear is defined by its module, which represents one of the most essential parameters in gears. The tip and root diameters determine the shape of the involute tooth profile, hence the addendum and dedendum factors. Furthermore, the design pressure angle and the value of the manufacturing shift coefficient also influence the tooth profile.
With the rise of electric vehicles, gearbox compactness has become increasingly important. Consequently, in the discussed algorithm implementation, the pitch diameters were selected as design variables to address spatial constraints explicitly and to facilitate the definition of domain boundaries. Thus, to uniquely determine the module for each gear stage, whether composed of two gears or including idlers, the number of teeth and the pitch diameter are specified for at least one gear per stage, especially where specific dimensional requirements are present.
Moreover, to better accommodate dimensional constraints, instead of directly specifying internal gear ratios or the number of teeth for each gear, a variable is introduced representing the sum of the nominal center distances of the gearbox stages. By specifying the total gear ratio as part of the design input, this approach enables the algorithm to derive the key geometric and kinematic parameters for the remaining gears in the assembly, ensuring consistency with overall layout requirements.
Finally, for each gear, the pressure angles, profile factors, shift coefficients, and face widths are defined as design variables. Each of these design variables is subject to specific boundaries, which are established by design constraints or informed by the designer's expertise. A comprehensive list of all design variables considered is provided in the accompanying Table 1.
Parameter
Name
Parameter
Name
Sum of nominal center distances
Σa
Addendum factor gear i
ha,i
Design pressure angle i-j
αij
Facewidth gear i
bi
Nominal diameter gear 1
d1
Input speed gear 1
n1
Number of teeth gear 1
z1
Input power
Pin
Nominal diameter gear 3 (compound)
d3
Target transmission ratio
tau
Number of teeth gear 3 (compound)
z3
Lubrication oil
μ, ρ
Profile shift factor gear i
xi
Gear Material
E, σ
Dedendum factor gear i
hf,i
Shafts position
(Xs, Ys)
Table 1—List of the design variables.
Design Objective Function
The objective functions considered in this work are geartrain efficiency and total weight, aiming to design a transmission that maximizes efficiency while minimizing mass.
Geartrain Efficiency
Power losses in gearboxes arise from various mechanical sources (Ref. 19). In this study, only the gear-related losses are taken into account, which are generally classified into load-dependent and load-independent components. To calculate the total power loss, the following expression is adopted:
(1)
where PVZP represents the load-dependent sliding losses, while PW, accounts for load-independent windage losses.
According to the Ohlendorf-Niemann model (Ref. 12), the sliding power loss can be expressed as follows:
(2)
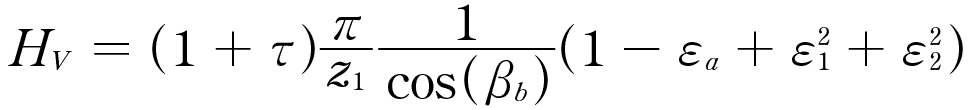
where Pin is the input power, μm is the mean coefficient of friction, and HV is a dimensionless factor that depends on spur gear pair geometry (number of teeth z and helix angle evaluated at the base circle βb) and contact ratios (overall transversal εa and access and recess transversal ε1 and ε2), given by:
(3)
[advertisement]
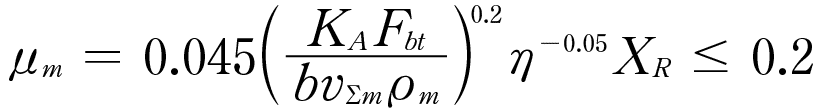
The mean coefficient of friction μm is a function of the normal tooth force, face width, the sum of pitch-line velocities, the rolling radius, and lubricant properties. It is calculated using the Niemann semi-empirical formulation:
(4)
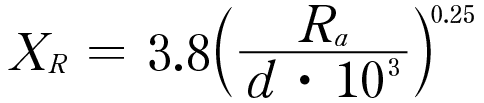
where Fbtis the force exchanged in the tangential plane, b is the face width, vΣm represents the rolling speed, ρm is the rolling radius, and η the oil dynamic viscosity at operating temperature. The correction coefficient XR can be computed as:
(5)
and depends on the gear diameter d and surface roughness Ra.
Windage losses are relevant in high-speed applications such as EV drivetrains and are evaluated using the semi-empirical model by Anderson and Lowenthal (Ref. 13). The model estimates aerodynamic drag due to gear rotation in a lubricated air-oil mixture environment. Losses are computed as a function of gear dimensions, rotational speed, and fluid properties, as follows:
(6)
where C3=2.82e-7,C4=0.019 in SI units, while r is the pitch diameter, b is the gear’s width, n is the rotational speed and η is the oil dynamic viscosity.
Geartrain Weight
The overall volume of the system is approximated as the sum of the volumes of each gear. Rather than modeling each gear tooth explicitly, the gear is represented as a disk with an outer diameter equal to the pitch diameter and an inner diameter corresponding to the defined bore. In this simplified approach, the volume of each gear is computed as the product of its cross-sectional area and face width. The total weight of the transmission can be calculated as:
(7)
This assumption reasonably approximates the bulk geometry while greatly decreasing computational effort.
Design Constraints
The constraints applied in this study are divided into three categories: geometric, layout, and safety constraints. Geometric constraints relate to the dimensions and form of individual gears and ensure the feasibility of each gear stage. Layout constraints address spatial and positional relationships between multiple gear stages, maintaining compatibility within the overall transmission architecture and satisfying specific requirements. Safety constraints concern the strength of the gears and are assessed through ISO standardized safety factors. All the implemented constraints are summarized and collected in Table 2.
Safety Constraints
The root and flank safety factors are the ratios between the modified value of allowable bending, σat , and contact, σac , and the calculated bending (σt) and contact (σc) stress, as shown in Equations 8 and 9. The modification or service factors are YN stress cycle factor for bending strength, which is imposed 0.7 for idler and 1 for simple gears, Yj temperature factor, YZ reliability factor, ZN stress cycle factor for contact stress and CH hardness ratio factor for contact stress.
(8)
(9)
The calculation of bending stress vt and contact stress vc, as well as the corresponding unmodified allowable stress values, follow the procedures outlined in ISO 6336 (Ref. 14). These values are derived based on the applied tangential load, gear tooth geometry, and material properties.
Geometric Constraints
As shown in Table 2, geometric constraints are the most numerous and cover many aspects. Constraints on gear size can be enforced by setting bounds on the tip or dedendum diameters, ensuring sufficient manufacturability, or accommodating the presence of other surrounding components. Additionally, several constraints are imposed on meshing geometry. First, through the KISSsoft COM interface, it is possible to verify whether the gear pair defined by the design variables results in a consistent meshing configuration. Once consistency is ensured, safety margins can be applied to critical meshing parameters, many of which are sensitive to the defined tolerances. In this context, each parameter's lower or upper bound is used as a constraint to minimize or maximize. Geometric constraints of this type include minimum tip clearance, minimum interference reserve, minimum normal tooth thickness at tip, minimum transverse contact ratio, and maximum sliding velocity at tip.
Constraint
Type
Formula
Transmission consistency
Geometric
consistency=1
Maximum tip diameter of gear i
Geometric
Minimum root diameter gear i
Geometric
Minimum tip clearance
Geometric
Minimum interference reserve
Geometric
Minimum normal tooth thickness at tip
Geometric
Minimum geometric contact ratio
Geometric
Maximum sliding velocity at tip
Geometric
Gear j axis inside required region
Layout
Target total transmission ratio
Layout
Coprime number of teeth
Layout
Root safety factor
Safety
Flank safety factor
Safety
Table 2—List of constraints implemented.
Layout Constraints
The final category of constraints concerns the overall geartrain architecture and its layout. The first constraint is the total transmission ratio between the input and output shafts, because the optimal design must preserve this ratio within a specified tolerance range around the target value. The second layout constraint involves the location of intermediate gears. Due to positioning or packaging requirements, it may be necessary for the projection of the center axis of an idler gear or a compound shaft to lie within a prescribed area. This admissible region is algorithmically defined as the union or intersection of circular zones or closed polygons. This method allows for an efficient geometric check to determine whether the projected axis lies inside or outside the specified region. Finally, a constructive constraint, which is often overlooked, has also been implemented regarding the number of teeth of meshing gears. They must be coprime, ensuring smooth transmission without common divisors that could lead to repeated contact patterns. In this way, homogeneous wear in each tooth will be ensured.
Optimization Process
After defining the problem, i.e., the design variables and their boundaries, the constraints, and the objective functions to be maximized or minimized, the optimization phase is carried out. The NSGA-II (Ref. 10) genetic algorithm was selected due to its efficient non-dominated sorting capabilities and its ability to populate the Pareto front uniformly. The Pareto front represents the set of optimal trade-off solutions in which no objective can be improved without degrading at least one other; in this context, it allows a direct comparison of different design alternatives balancing efficiency and weight. For each of the selected objective functions, it is good practice to perform separate single-objective optimizations in order to understand the evolution of the design solutions and assess the algorithm's performance with respect to the chosen design space and constraints. Subsequently, multi-objective optimization is performed to determine the Pareto front of non-dominated designs. In all cases, the optimization process follows the algorithm illustrated in Figure 2.
Figure 2—Optimized design procedure.
The process begins with an initial population generated using the Uniform Latin Hypercube (ULH) sampling method, which ensures a well-distributed set of design seeds. This method promotes uniform coverage of the design space, minimizes induced correlation among design variables, and maximizes the distance between sampled points. In the evaluation phase, each individual design is assessed by computing the values of the objective functions and constraint-related parameters. Once the entire population has been evaluated, the algorithm ranks the solutions based on objective values and constraint satisfaction. Specifically, feasible solutions are ranked according to Pareto dominance; feasible designs are always prioritized over unfeasible ones, and unfeasible solutions are ordered based on the number of violated constraints, with those violating fewer constraints ranked higher. Suppose the current generation count is less than the predefined maximum. In that case, parent designs are selected and used to create the remaining individuals of the new population by applying crossover and mutation of parents’ genes according to predefined probabilities. At the end of this heuristic process, a total of N populations times M individuals will have been evaluated. Considering only feasible designs, the process yields either the Pareto front (in the multi-objective case) or the single optimal individual (in the single-objective case). For the geartrain design process considered in this work, the evaluation process consists of several steps implemented in Python, utilizing the KISSsoft COM interface. Starting from the design variables described in the section “Multi-Stage Gearbox Transmission System and Design Variables” and listed in the corresponding Table 3, the total transmission ratio, the pitch diameter, and the number of teeth of one gear per stage level, and the sum of nominal center distances are used to determine the gear modules and the number of teeth on the intermediate gears. By including the profile shift coefficients, the actual operating center distances for each stage are computed, allowing the whole layout of the transmission to be determined, given the fixed positions of the input and output shafts. In the case of the idler gear, its module and pressure angle are inherited from the mating gears, while its number of teeth is determined by the selected module and the center distances imposed by the layout. The feasible design range is thus defined by the spatial constraints set for the gearbox and the meshing conditions with both adjacent gears, while the remaining design parameters (e.g., profile factors) and constraints are selected within the same boundaries defined for all gears in the geartrain. To reduce computational cost, the layout calculation employs Erone’s formula, which enables the determination of a triangle’s area based solely on the lengths of its three sides. This allows for positioning all gears in the geartrain and, if requested, verifying that their centers fall within the specified spatial constraints. The operating center distances and all geometric parameters are then passed through the COM interface to KISSsoft, where root radii are computed, tolerances are applied, and all gear meshes in the transmission are analyzed under the specified input power and rotational speed. In particular, sliding power losses (evaluated as described in the “Design Objective Functions” section), safety factors, and meshing consistency are computed to assess the feasibility of the design. Finally, considering the established bore radius of each gear body, the volume and resulting mass of all gears in the transmission are calculated. Windage losses are estimated using the model proposed by Anderson and Lowenthal, and the total transmission efficiency is then obtained.
Case Studies
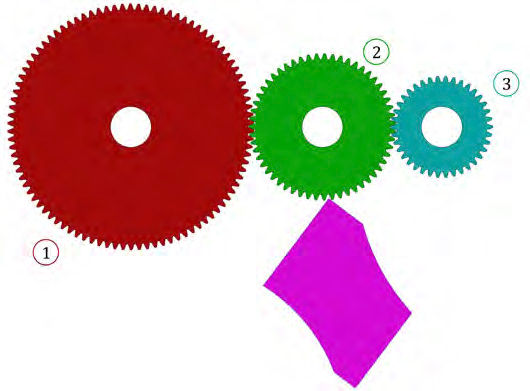
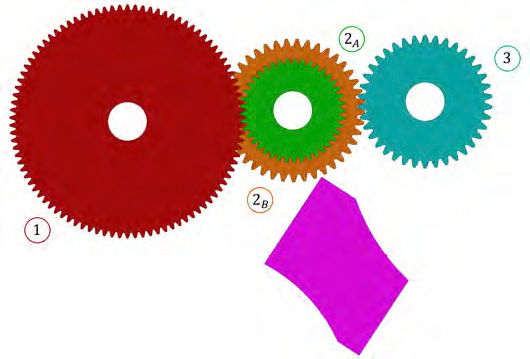
The methodology discussed in the previous chapters was applied to a case study based on a two-stage transmission layout previously presented in the literature (Refs. 20, 21), configured with an idler gear and gears’ tooth numbers of 94-55-38, as well as operating pressure angles of 21.22 degrees and 21.02 degrees. The corresponding baseline compound configuration was defined by maintaining the same overall transmission ratio and keeping the positions of the input and output shafts unchanged. Figure 3 illustrates both baseline configurations, distinguishing the idler geartrain case from the equivalent compound layout. In fuchsia, the required domain for the intermediate gear center is shown. Starting from the initial layouts, the total gear ratio of the two-stage transmission was computed, along with the positions of the input and output gears. As previously described, these three quantities are treated as fixed parameters in the optimization process to identify the gear set's optimal layout and macro-geometry. The optimization process considers an operating condition characterized by a power input, Pin, and a rotational speed at the input shaft, n1.
Figure 3—Baseline geartrain designs. On the top, the architecture with idler gears; on the bottom, the architecture with the compound shaft.
The optimization variables and their corresponding boundaries are defined based on the methodology described earlier.
Hence, limits on the input gear diameters are determined by maximum space constraints and, on the lower end, by design limitations due to the presence of other components or manufacturing constraints. Once the diameter bounds are selected, the corresponding gear tooth numbers are derived such that the gear modules for both meshing pairs fall within the range of 0.3 to 6 mm. All variables, their respective limits, and the fixed parameters for the optimization are listed in Table 3 for both configurations considered in the case study.
Parameter
Name
Value
Minimum
Maximum
Unit
Sum of nominal center distances
Σa
-
152.5
322
mm
Design pressure angle i-j
αij
-
18
27
°
Nominal diameter gear 1
d1
-
75
180
mm
Number of teeth gear 1
z1
-
30
250
-
Nominal diameter gear 3 (compound)
d3
-
30
120
mm
Number of teeth gear 3 (compound)
z3
-
20
100
-
Profile shift factor gear i
xi
-
0
0.6
-
Dedendum factor gear i
hf,i
-
0.7
1.4
-
Addendum factor gear i
ha,i
-
0.6
1.3
-
Facewidth gear i
bi
-
5
20
mm
Input speed gear 1
n1
5000
-
-
rpm
Input power
Pin
125
-
-
kW
Target transmission ratio
tau
2.474
-
-
-
Lubrication oil
ISO-VG 220
Gear Material
Grade 2, AGMA Steel, HRC58-64, case-hardened
Shafts position
(0,0); (152.3,0)
Table 3—List of the design variables adopted.
The constraints considered were previously discussed and are summarized in Table 4 below for the specific cases examined. In particular, as for the layout constraint, it is required that the center of the idler gear (or compound shaft) lies within the feasible domain illustrated in fuchsia in Figure 3.
Constraint
Formula
Transmission consistency
consistency=1
Target total transmission ratio
Root safety factor
Flank safety factor
Maximum tip diameter of gear 1
Minimum root diameter of gear 1
Minimum root diameter gear 3
Minimum tip clearance
Minimum interference reserve
Minimum normal tooth thickness at tip
Gear 2 axis inside required region
Coprime number of teeth
Minimum geometric contact ratio
Maximum sliding velocity at tip
Table 4—List of constraints adopted in the case study.
The NSGA-II algorithm was run for 40 generations, starting from a population of 60 seeds, thus, 2400 evaluations. The algorithm was configured with a crossover probability of 90 percent and a mutation probability of 100 percent, incorporating controlled elitism to enhance the exploration of the design space and improve the uniformity of the solution distribution. Under these settings, the optimization process required approximately 2 hours on a 4.00 GHz multicore workstation (AMD Ryzen 9 8945HS).
Results and Discussion
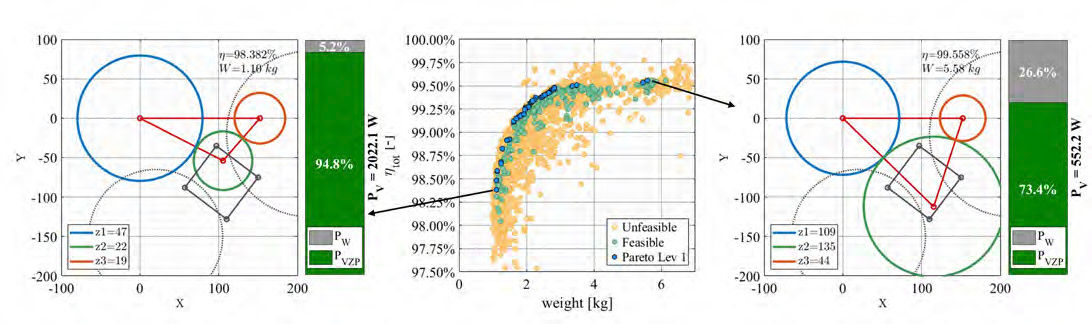
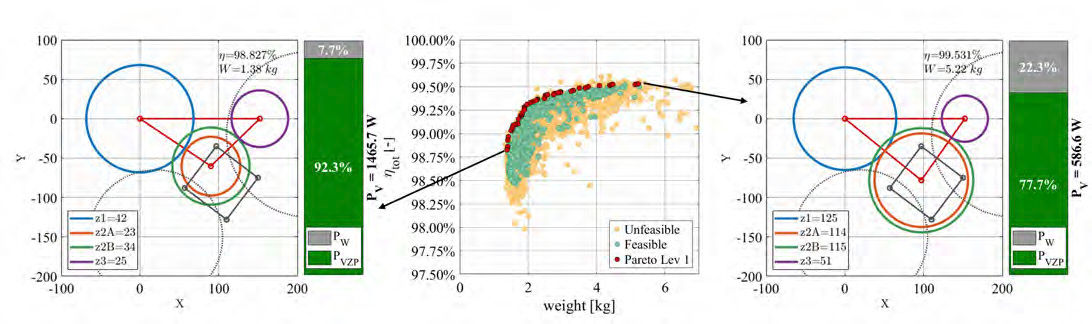
The results of the multi-objective optimizations for the two configurations are presented in Figure 4 and Figure 5, for the idler gear configuration and the compound gear configuration, respectively. The central scatter plots in each figure display the evaluated designs in the total transmission efficiency versus weight space. In these plots, feasible solutions, thus those that do not violate any constraints, are highlighted in green, while unfeasible ones are shown in orange. Additionally, non-dominated solutions forming the first Pareto fronts are highlighted in blue and red, respectively. Across the entire optimization process, approximately 64 percent of the evaluated candidates were discarded because they had violated at least one manufacturing/design constraint. Considering individual constraints, tooth interference reserve was violated in 29 percent of the designs, insufficient clearance in 27 percent, minimum tooth tip thickness in 39 percent, and minimum contact ratio in 25 percent. These violation rates, being of relevant magnitude, highlight the importance of considering these constraints, as each has a significant impact on shaping and characterizing the feasible design space throughout the optimization process. In both figures, the designs with the highest efficiency are depicted on the right side of the scatter plots, while those with the lowest weight are presented on the left. These correspond to, or closely approximate, the results obtained from the single-objective optimizations aimed at individually maximizing or minimizing the two objectives. In addition to the three or four gears constituting the transmission, the figures depict, in red, the center distances between meshing gears and, in gray, the feasible region where the trace of the intermediate shaft axis must be located. The solid gray line defines the boundary within which this axis must reside. In contrast, the dashed gray lines represent the regions from which the axis must be excluded, in this case, two limiting circles. Considering both the designs of Figures 4 and 5 while also taking into account the trends of Figures 6 and 7, it is evident in both cases that, in order to reduce power losses due to sliding and thereby improve efficiency, the optimization algorithm tends to evolve toward solutions featuring a high number of teeth (see legends) and low modules. However, such evolution requires higher pressure angles and wider face widths to ensure adequate strength. These solutions, which are shown on the right side of each figure, are generally less compact and significantly heavier due to larger pitch diameters and gear widths. Conversely, the low-weight configurations are characterized by taller teeth, i.e., a higher module. This allows for stronger teeth, enabling narrower face widths and hence reduced diameters and overall transmission weight.
Figure 4—Results of the simple geartrain (idler).Figure 5—Results of the compound geartrain.
Comparing the results in Figure 4 and Figure 5, it can be observed that, under identical boundary conditions, the algorithm applied to the four-gear compound configuration can more uniformly and effectively populate the Pareto front. In contrast, the optimization applied to the idler gear configuration struggles to develop a well-defined front. This effect is partly due to the higher constraint violation rate in the idler case (77.62 percent of generated designs), primarily caused by simultaneous meshing conditions that increase interference reserve and clearance conflicts. Consequently, under the same number of evaluations, the algorithm finds it more challenging to generate feasible solutions. Finally, comparing the solutions presented on the Pareto front, both configurations exhibit similar efficiency levels. The constraints established in the case study enable idler gear solutions to achieve sliding power losses that are comparable to those of the compound configuration, despite requiring more in-plane space. Conversely, the compound configuration requires out-of-plane space and incorporates gear 2B, which results in an increase in windage power loss, aligning it with the idler configuration. Both figures reveal that windage loss along the Pareto front increases its ratio between approximately 5 percent and nearly 30 percent for both configurations. On the other hand, considering the weight objective, the idler configuration benefits from the absence of additional gears, rendering it lighter. However, the difference is not significant because the design flexibility of the compound configuration allows for the use of smaller gear diameters.
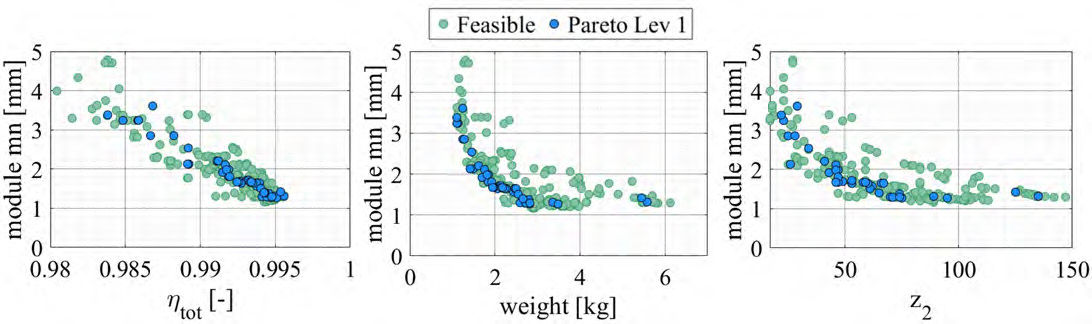
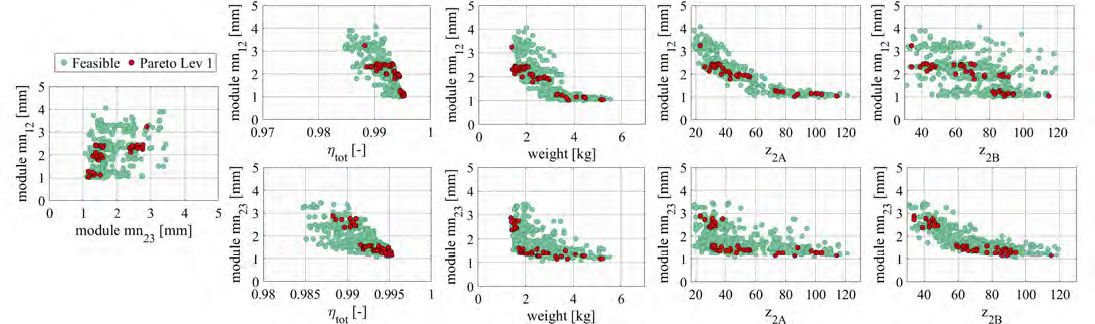
Figure 6—Simple geartrain (idler): correlation between module, idler number of teeth, efficiency, and weight for the feasible designs.Figure 7—Simple geartrain (idler): correlation between stage modules, compound gears number of teeth, efficiency, and weight for the feasible designs.
Conclusion
This work has presented a performance-driven design procedure for multistage gear transmissions in the context of electric drive systems. With the rise of electric vehicles, gearbox compactness has become increasingly demanding; moreover, high-speed operating conditions demand that such transmissions be designed with a focus on both efficiency and weight, while also obeying system size constraints. The proposed optimization framework applies to both simple and compound geartrains. To enhance domain flexibility, the design variables include the pitch diameters, number of teeth, profile factors, shift coefficients, and the design pressure angle. Thus, ensuring a highly general and explorative design space. The algorithm also enables the explicit consideration of overall layout constraints, including specific positional requirements for intermediate gears. The enforcement of coprime gear tooth numbers, along with the incorporation of manufacturing tolerances and industrially relevant geometric constraints, guarantees that the resulting Pareto designs are not only theoretically valid but also practically feasible. Furthermore, the integration of KISSsoft through its COM interface guarantees result reproducibility and the level of formality expected in industrial contexts. For these reasons, the methodology is a valuable support tool for practical geartrain design, providing a more systematic alternative to traditional design of experiments (DOE) and trial-and-error approaches. Moreover, it allows for the formal integration of mathematically defined design constraints with best practices that experienced designers frequently use. The proposed procedure has been applied to a case study, in which Pareto-optimal designs were obtained for both a simple and a compound two-stage geartrain, given fixed positions for the input and output shafts and a prescribed overall transmission ratio. The results indicate that the compound configuration offers greater flexibility, allowing for a more comprehensive exploration of the feasible design space and, thus, a denser population of the Pareto front with the same number of algorithm iterations. While this work focused on mapping and populating the Pareto front, an important next step is the integration of decision-making techniques to guide the selection of a single preferred design according to application-specific priorities. Methods such as the linear programming technique for multidimensional analysis of preference (LINMAP), the technique for order of preference by similarity to ideal solution (TOPSIS), or fuzzy-logic-based robust ranking approaches could be employed to systematically evaluate the trade-offs between competing objectives, thus prioritizing efficiency over weight or balancing both for a specific duty cycle. This decision-making stage could be coupled with application-dependent definitions of design life and safety factors, possibly derived from load spectrum-based analyses such as the rainflow method (Ref. 22). Moreover, cost and manufacturability aspects could be explored, for example, when non-standard addendum/dedendum coefficients or pressure angles are involved, and discrete optimization with standardized gear profiles could be investigated to simplify production without significantly reducing performance. Additionally, new constraints could be implemented to consider the actual dimensions of the gear bodies, rather than just focusing on the axis projections, and to link gears across different stages, which would help prevent potential interference between shafts in compound configurations. Finally, it would be advantageous to validate the results using the contact-based loss and strength models provided by KISSsoft, assessing its computational effort and identifying any deviations from the current modeling approach.
References
E. Esmail , E. Pennestrì and M. Cirelli, “Power-flow and mechanical efficiency computation in two-degrees-of-freedom planetary gear units: New compact formulas,” Applied Sciences, Vol. 11, No. 13, p. 5991, 2021.
M. Autiero, M. Cirelli, G. Paoli and P. P. Valentini, “ Data-Driven Approach to Estimate the Power Loss and Thermal Behaviour of Cylindrical Gearboxes under Transient Operating Conditions,” Lubricants, Vol. 11, No. 7, p. 303, 2023.
S.-c. Kim, S.-g. Moon, J.-h. Sohn, Y.-j. Park, C.-h. Choi and G.-h. Lee, “Macro geometry optimization of a helical gear pair for mass, efficiency, and transmission error,” Mechanism and Machine Theory, Vol. 144, p. 103634, 2020.
E. Ben Younes, C. Changenet, J. Bruy, E. Rigaud and J. Perret-Liaudet, “Multi-objective optimization of gear unit design to improve efficiency and transmission error,” Mechanism and Machine Theory, Vol. 167, p. 104499, 2022.
D. Miler, D. Žeželj, A. Lončar and K. Vučković, “Multi-objective spur gear pair optimization focused on volume and efficiency,” Mechanism and Machine Theory, Vol. 125, pp. 185–195, 2018.
M. Patil, P. Ramkumar and K. Shankar, “Multi-objective optimization of the two-stage helical gearbox with tribological constraints,” Mechanism and Machine Theory, Vol. 138, pp. 38–57, 2019.
L. Cianciotta, M. Cirelli and P. P. Valentini, “Multi-Objective Optimization of Gear Design of E-Axles to Improve Noise Emission and Load Distribution,” Machines, Vol. 13, p. 330, 2025.
S. Sundaresan, K. Ishii, and D. R. Houser, “A Procedure Using Manufacturing Variance to Design Gears with Minimum Transmission Error,” ASME. J. Mech. Des., Vol. 113, No. 3, pp. 318–324, 1991.
D. R. Houser and J. Harianto, “Design robustness and its effect on transmission error and other design parameters,” Gear Technology, Vol. 20, No. 2, pp. 18–25, 2003.
K. Deb, A. Pratap, S. Agarwal and T. Meyarivan, “A fast and elitist multiobjective genetic algorithm: NSGA-II,” IEEE Transactions on Evolutionary Computation, Vol. 6, No. 2, pp. 182–197, 2002.
KISSsoft AG, KISSsoft User Manual, Bubikon, Switzerland.
G. Niemann and H. Winter, Maschinenelemente, Band ٢, Berlin: Springer, 1983.
N. E. Anderson and S. H. Loewenthal, “Effect of Geometry and Operating Conditions on Spur Gear System Power Loss,” Journal of Mechanical Design, Vol. 103, pp. 151–159, 1981.
International Organization for Standardization, “ISO ٦٣٣٦: Calculation of load capacity of spur and helical gears–Part 1,2,3,5,” Berlin, 2019.
Artoni, “A methodology for simulation-based, multiobjective gear design optimization,” Mechanism and Machine Theory, Vol. 133, pp. 95–111, 2019.
K. Deb e S. Jain, “Multi-Speed Gearbox Design Using Multi-Objective Evolutionary Algorithms,” J. Mech. Des., Vol. 125, No. 3, pp. 609–619, 2003.
L. D'Angelo, M. Cirelli, O. Giannini and P. P. Valentini, “Fuzzy logic assessment of epistemic uncertainties in pseudo-rigid multibody gear models,” Proceedings of ISMA 2024–International Conference on Noise and Vibration Engineering and USD 2024–International Conference on Uncertainty in Structural Dynamics, Vol. Leuven, pp. 4276–4290, 2024.
International Organization for Standardization, “ISO 21771-1:2024 Cylindrical involute gears and gear pairs Part ١: Concepts and geometry.”
C. M. Fernandes, P. M. Marques, R. C. Martins and J. H. Seabra, “Gearbox power loss. Part II: Friction losses in gears,” Tribology International, Vol. 88, pp. 309–316, 2015.
G. Liu and R. G. Parker, “Dynamic modeling and analysis of tooth profile modification for multimesh gear vibration,” Journal of Mechanical Design, Vol. 130, No. 12, pp. 1214021–12140213, 2008.
G. Liu and R. G. Parker, “Nonlinear dynamics of idler gear systems,” Nonlinear Dynamics, Vol. 53, No. 4, pp. 345–367, September 2008.
U. Kissling, “Use of duty cycles or measured torque-time data with AGMA ratings,” 21FTM07: Fall Technical Meeting, pp. 48–54, 2021.
First presented at the 2025 Fall Technical Meeting (FTM), October 22–24, 2025, Detroit, and printed with permission of the author(s). Statements presented in this paper are those of the author(s) and may not represent the position or opinion of the American Gear Manufacturers Association.
[advertisement]
×
Like What You see?
Power Transmission Engineering is THE magazine of mechanical components. PTE is written for engineers and maintenance pros who specify, purchase and use gears, gear drives, bearings, motors, couplings, clutches, lubrication, seals and all other types of mechanical power transmission and motion control components.
*Unsubscribe any time. Full details in our privacy policy


 Power Transmission Engineering is THE magazine of mechanical components. PTE is written for engineers and maintenance pros who specify, purchase and use gears, gear drives, bearings, motors, couplings, clutches, lubrication, seals and all other types of mechanical power transmission and motion control components.