Novel Steel Grade Resists Fatigue as Life Becomes Harder for Bearings
Finding new steel grades with robust fatigue properties is becoming increasingly important for heavy vehicles. A key driver is the accelerating trend towards electrification that imposes additional loads on the powertrain.
Specifically, the electrification of large goods vehicles requires improved fatigue properties under both high cycle fatigue (HCF) and very high cycle fatigue (VHCF). There are three main contributing factors. First, electric motors in large goods vehicles operate typically at a much wider range of rpm than internal combustion engines and second, they generate increased torque compared with cars. This requires superior fatigue strength to ensure an adequate life for powertrain components. Third, the substantial weight of the traction batteries, crucial for long range, exerts considerable additional stress on the vehicle’s structure, and especially bearings.
It is possible to improve fatigue resistance by increasing the thickness of material used in critical components. However, this imposes a weight penalty that would impact the load-carrying capacity of a vehicle already challenged by the weight of its traction batteries. This is creating interest in novel steel grades that can deliver enhanced fatigue properties with no increase in component size. This is where Ovako’s Hybrid Steel 60 shows particular promise.
Fatigue failure generally results from the accumulation of microplastic deformation under repeated cyclic conditions. The term microplastic refers to the microscopically small areas of the component where the material is subject to plastic deformation while the bulk retains its elastic properties.
This type of failure affects the service life of a wide range of machine components, such as gears, rolling bearings, and camshafts. Rolling bearings often operate under elastohydrodynamic lubrication (EHL). This is a regime where significant elastic deformation of the surfaces takes place, with a considerable effect on the shape and thickness of the lubricant film. This leads to alternating contact stresses within a small area that can cause subsurface damage known as rolling contact fatigue (RCF). The result is microstructural changes in the contact areas that ultimately manifest as fatigue damage.
Previous Research Work on the Most Common Bearing Steel
Previous investigations focused on the microstructural decay resulting from RCF with the most common bearing steel, grade 52100. The microstructure of 52100 steel comprises tempered carbides, residual cementite (RC), and a martensitic matrix. Types of microstructural decay identified during RCF include the formation of dark etching regions, white etching bands, and carbide dissolution (RC and tempered carbides). This decay becomes apparent after a high number of stress cycles, leading to a decrease in hardness and subsequent degradation of the bearing.
The ability of a material to withstand RCF depends on its composition and heat treatment. Using materials that resist softening can extend the lifespan of bearings.
The Promise of Hybrid Steel
In recent years, Ovako has introduced Hybrid Steel 60. This is a novel grade combining secondary hardening and intermetallic precipitates. It was developed to overcome the limitations of existing materials, particularly for bearings subject to challenging operational conditions such as in corrosion and hydrogen environments. However, a more comprehensive understanding of how it behaves under RCF is crucial to predict its response to cyclic loading. This was the basis for this PhD project which comprised extensive laboratory testing and analysis to identify how Hybrid Steel 60 decays under RCF.
Test Materials
The test program compared 52100 and Hybrid Steel 60 bearing steels with the chemical compositions shown in Table 1. Both steels were manufactured and heat-treated by Ovako.
Before heat treatment the samples were machined into disc shapes suitable for RCF testing. After heat treatment, a 0.5 mm layer of material was removed by grinding to eliminate the decarburized layer for both materials.
Steel
C
Si
Cr
Ni
Mn
Al
V
Cu
52100
1.0
0.35
1.6
0.2
0.40
0.03
-
0.09
Hybrid 60
0.28
0.10
5.61
5.94
0.28
2.41
0.49
-
Table 1—Chemical composition of the tested steels (wt.%).
Test Method
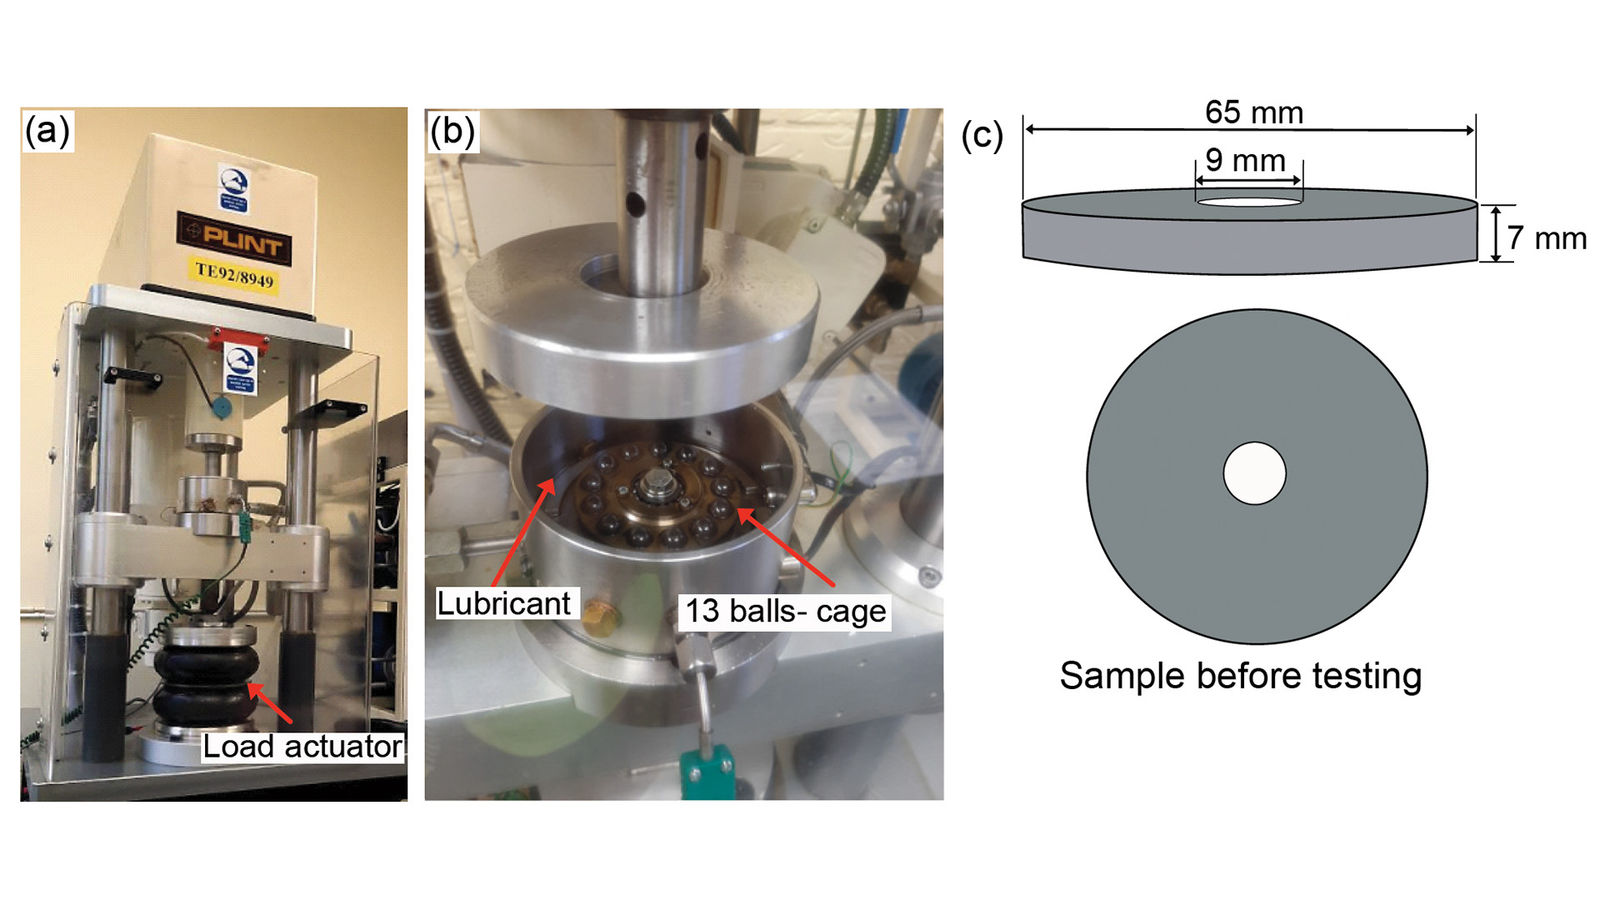
The disc-shaped samples had outer and inner diameters of 65 and 9 mm, respectively, and a thickness of 7 mm, the sample geometry is shown in Figure 1(c). Final preparation before RCF testing included grinding and polishing of the surface to ensure a smooth and consistent surface finish.
Figure 1—RCF test setup.
The RCF tests were carried out in a flat washer test rig, which is a microprocessor-controlled rotatory tribometer. This has 13 silicon nitride balls in a cup that is the outer race of a bearing. SAE 5W-40 oil was used as the lubricant, with the temperature set at 100°C. A summary of the test conditions is given in Table 2.
Parameter
Value
Lubricant
Motor oil/SAE 5w-40
Temperature
100°C
Contact Pressure
2.8 GPa
Stress Cycles
1.0 × 10⁸
Ball Material
Silicon Nitride (Si3N4)
Ball Diameter, D
10 mm
Young’s Modulus (Ball Material)
315 GPa
Poisson’s Ratio (Ball Material)
0.28
Young’s Modulus (52100/Hybrid 60)
200–210 GPa
Poisson’s Ratio (52100/Hybrid 60)
0.3
Surface Roughness, Ra
0.02 µm
Table 2—RCF experimental parameters used for testing of Hybrid Steel 60 and 52100 steels.
The test conditions and surface finish of the specimen and balls resulted in an elastohydrodynamic film thickness ratio of hmin = 0.053 and λ = 2.6, as calculated through the Hamrock & Dowson method. A single circular contact track was formed on the sample’s surface during testing over 1.0 × 10⁸ stress cycles.
Examination of Samples
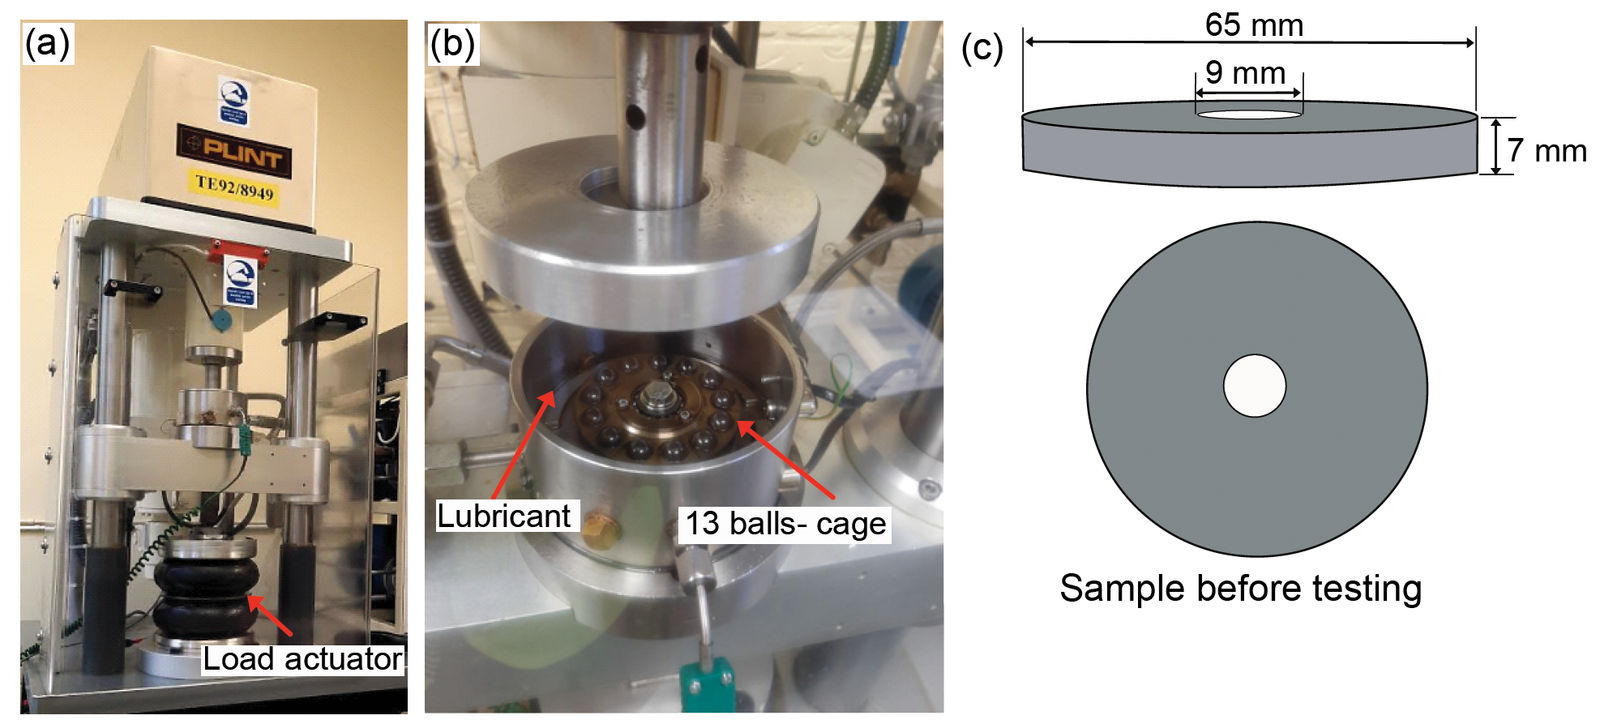
Following the RCF test, samples were extracted from areas both parallel (circumferential-section) and transverse (radial-section) to the rolling direction (see Figure 2). The samples were ground and polished in preparation for microscopic inspection. For the circumferential-section care was taken to polish until the center of the microstructural decay region was reached. For both materials, the virgin microstructure and the microstructural decay were examined using scanning electron microscopy (SEM) and electron backscatter diffraction (EBSD).
Figure 2—The circular contact track formed after the RCF test is shown as a dark grey line. The red line and arrow indicate the circumferential and radial sections before cutting. The extracted circumferential and radial section samples with the contact track are also shown.
[advertisement]
After investigation by backscattered electron (BSE) imaging and EBSD, the samples were etched for SEM examination using secondary electron (SE) imaging.
The electron micrographs were then processed using specialist image processing software to analyze the average size distribution of residual cementite (RC) and tempered cementite. Seven SE micrographs at 6000x magnification were used, and a binary threshold was set to identify the carbides. The size of tempered carbides was evaluated using fitted ellipses. Their aspect ratio was obtained by dividing the length of the major axis by the length of the minor axis. Moreover, the size of RC was defined by the diameter.
The area fraction of material decay was determined using the Point Count method from the ASTM 562-19 protocol.
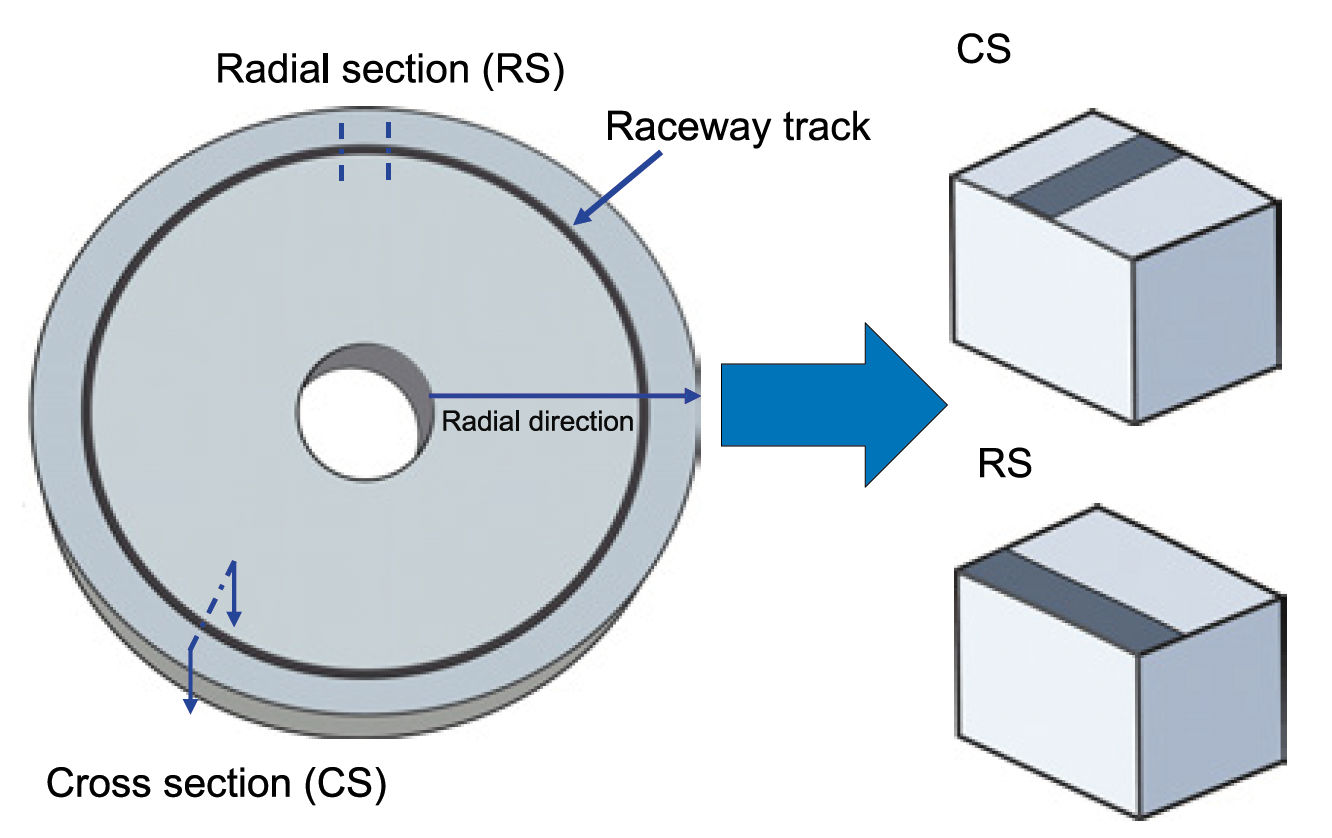
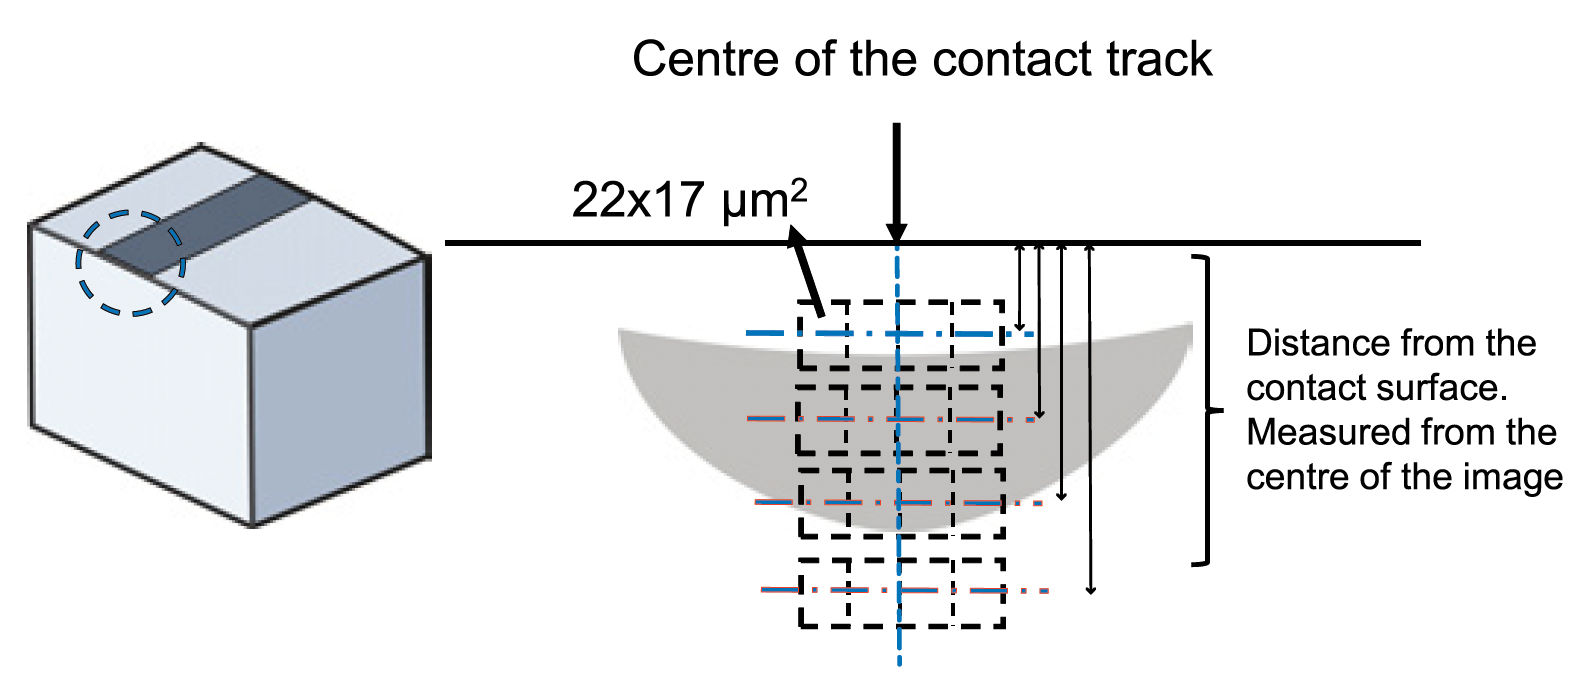
Four high-resolution images were obtained at four different depths (50, 75, 100, and 125 µm.) for each material, with each image size being 22 × 17 µm2 (see Figure 3).
Figure 3—The sample orientation for determining the area fraction of microstructural decay in the radial section sample. The schematic indicates the size, number and position of the SEM images.
For the analysis, 374 grid points were used in each image to calculate the area fraction of material decay on the radial section of the raceway track. Figure 3 illustrates the configuration and the position of the images.
Hardness Testing
A nanoindenter with a diamond tip was used to test for hardness in the microstructural decay area on the radial section. In addition, a Knoop indenter was used for microhardness measurements on the radial sections of unetched samples.
The variation in hardness concerning depth beneath the raceway track was evaluated with the measured values from the Knoop indenter converted to Vickers hardness (HV). The first hardness indentation was performed 30 µm below the raceway track, and the hardness was measured until a depth of 350 µm below the track. Three measurements were made at each depth to increase the confidence of the measured average hardness.
Results and Discussion
Virgin Materials
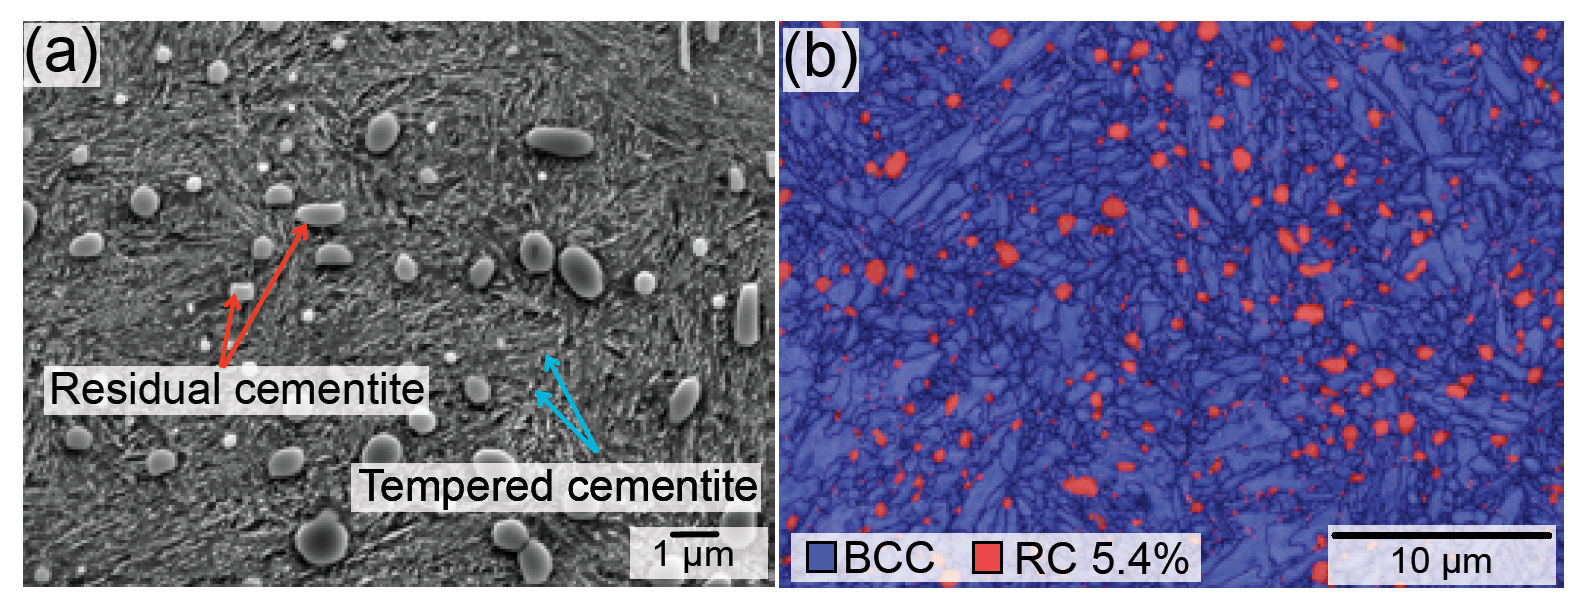
Figure 4—52100 virgin material. (a) SEM/SE micrograph showing tempered cementite and RC. (b) EBSD image quality and phase map overlaid showing martensite in grey (94.6 percent) and RC in red (5.4 percent).
Figure 4(a) shows the SEM image of the as-heat-treated virgin sample of 52100 steel. The steel has a martensitic structure with the average diameter of RC determined to be 0.72 ± 0.22 µm with an aspect ratio of 1.58 ± 0.39. The volume percentage of RC determined from the EBSD phase map is 5.40 ± 0.42, see Figure 4(b). The image analysis using the SEM micrographs indicates that the volume percentage of tempered cementite is about 15 percent.
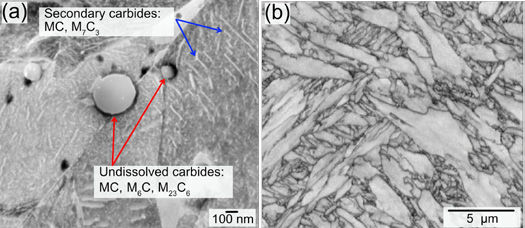
Figure 5—Hybrid Steel 60 virgin material. (a) SEM/SE image showing secondary carbides and undissolved carbides within the martensitic microstructure. (b) EBSD image quality map showing martensite laths.
The as-heat-treated microstructure of Hybrid Steel 60 is shown in Figure 5(a)(b), it comprises lath martensite, Figure 5(a)(b), secondary carbides such as MC and M7C3 (plate-like carbides), NiAl intermetallic precipitates, and a small number of undissolved precipitates MC, M2C, and M6C.
Microstructural Decay
52100 Steels
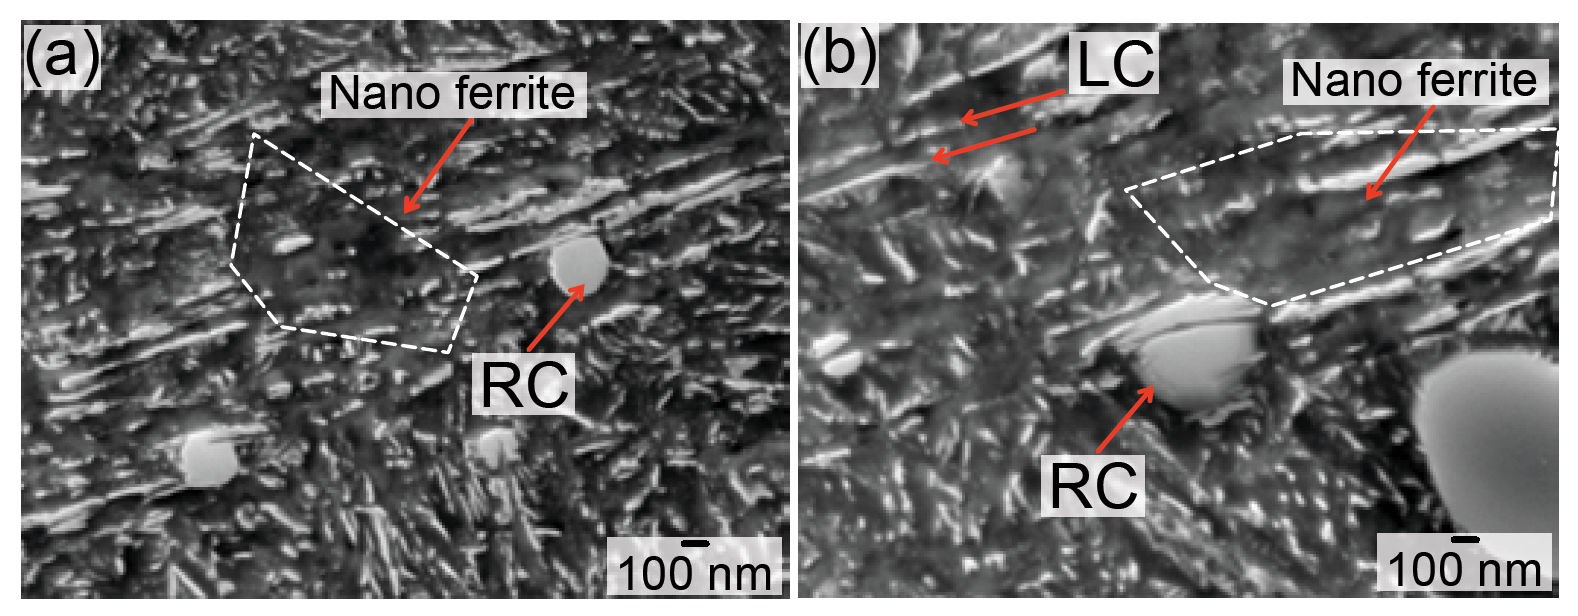
Figure 6—SEM/SE imaging of decay in 52100 steel after RCF in the CS at 80 μm from the contact surface. (a) Decay at 1.0 × 10⁸ stress cycles, tempered carbides dissolution, nano ferrite patches, residual cementite decay. (b) Residual cementite decay, by ferrite intersecting the carbides, surrounded by nano ferrite patch.
The microstructural decay observed in the region of maximum shear stress (40–130 µm) in 52100 steel after testing is shown in Figure 6(a)(b). Here, the original martensite laths disappear combined with dissolution of residual cementite and tempered carbides. The disappearance of the martensite laths is related to the formation of ferrite microbands and nano-sized ferrite, as shown by the enclosed dotted white line. Figure 6(b) shows the decay of RC, where the accumulation of dislocations at the RC interface induces partial dissolution of the cementite. The figure also shows that the elongated ferrite penetrates the cementite. No tempered cementite is observed near and within the elongated ferrite and ferrite microband, indicating the tempered cementite has been dissolved.
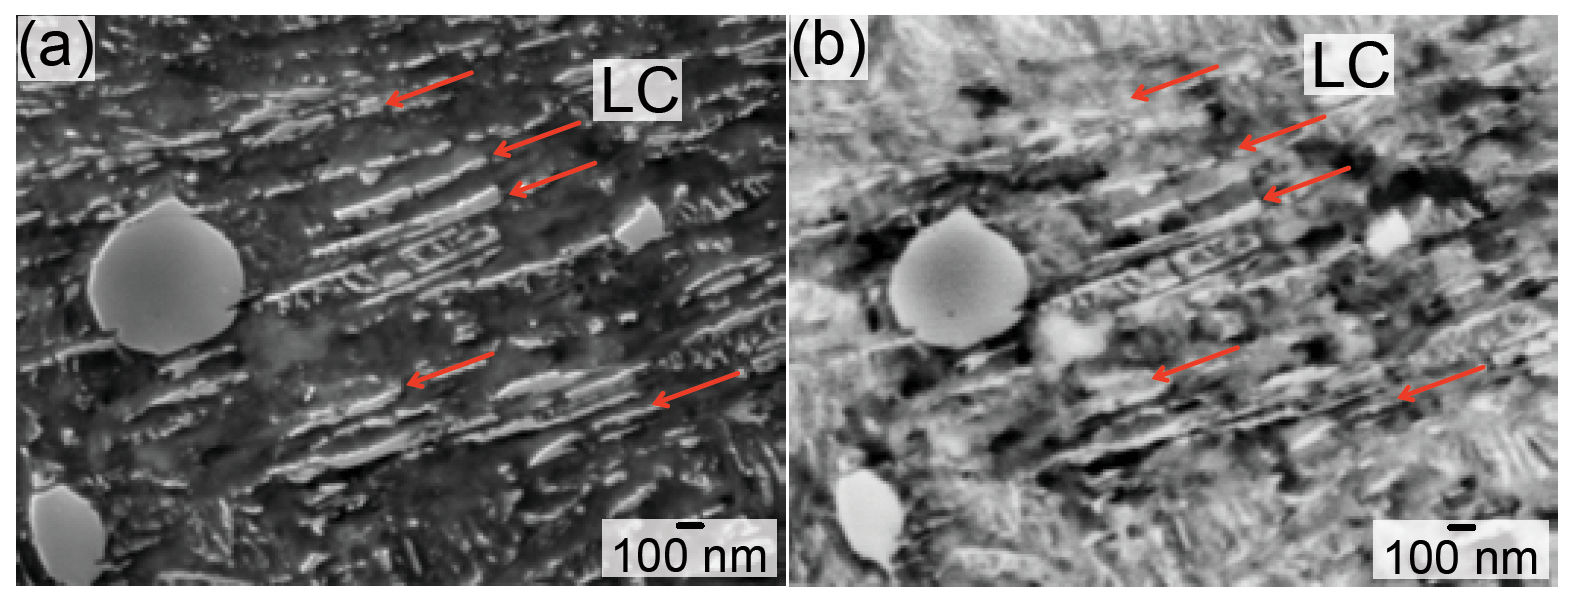
During the initial stages of RCF, the emergence of lenticular cementite adjacent to elongated ferrite was detected. The bright contrast of the lenticular cementite resembles the tempered cementite observed in SEM/SE imaging but other than the contrast, the lenticular cementite (LC) varies in size, alignment, and position compared to the tempered cementite. Further proof is presented in Figure 7(a)(b), and has also been shown in previous research.
Figure 7—Microstructural decay in 52100 steel after RCF at 1.0 × 10⁸ stress cycles in the CS, at 40–130 μm from the contact surface. (a) SEM/SE image reveals the presence of LC, indicated by yellow arrows. (b) SEM/BSE image of the same area as (a), bright contrast (yellow arrows) indicated the presence of LC.
Hybrid Steel 60
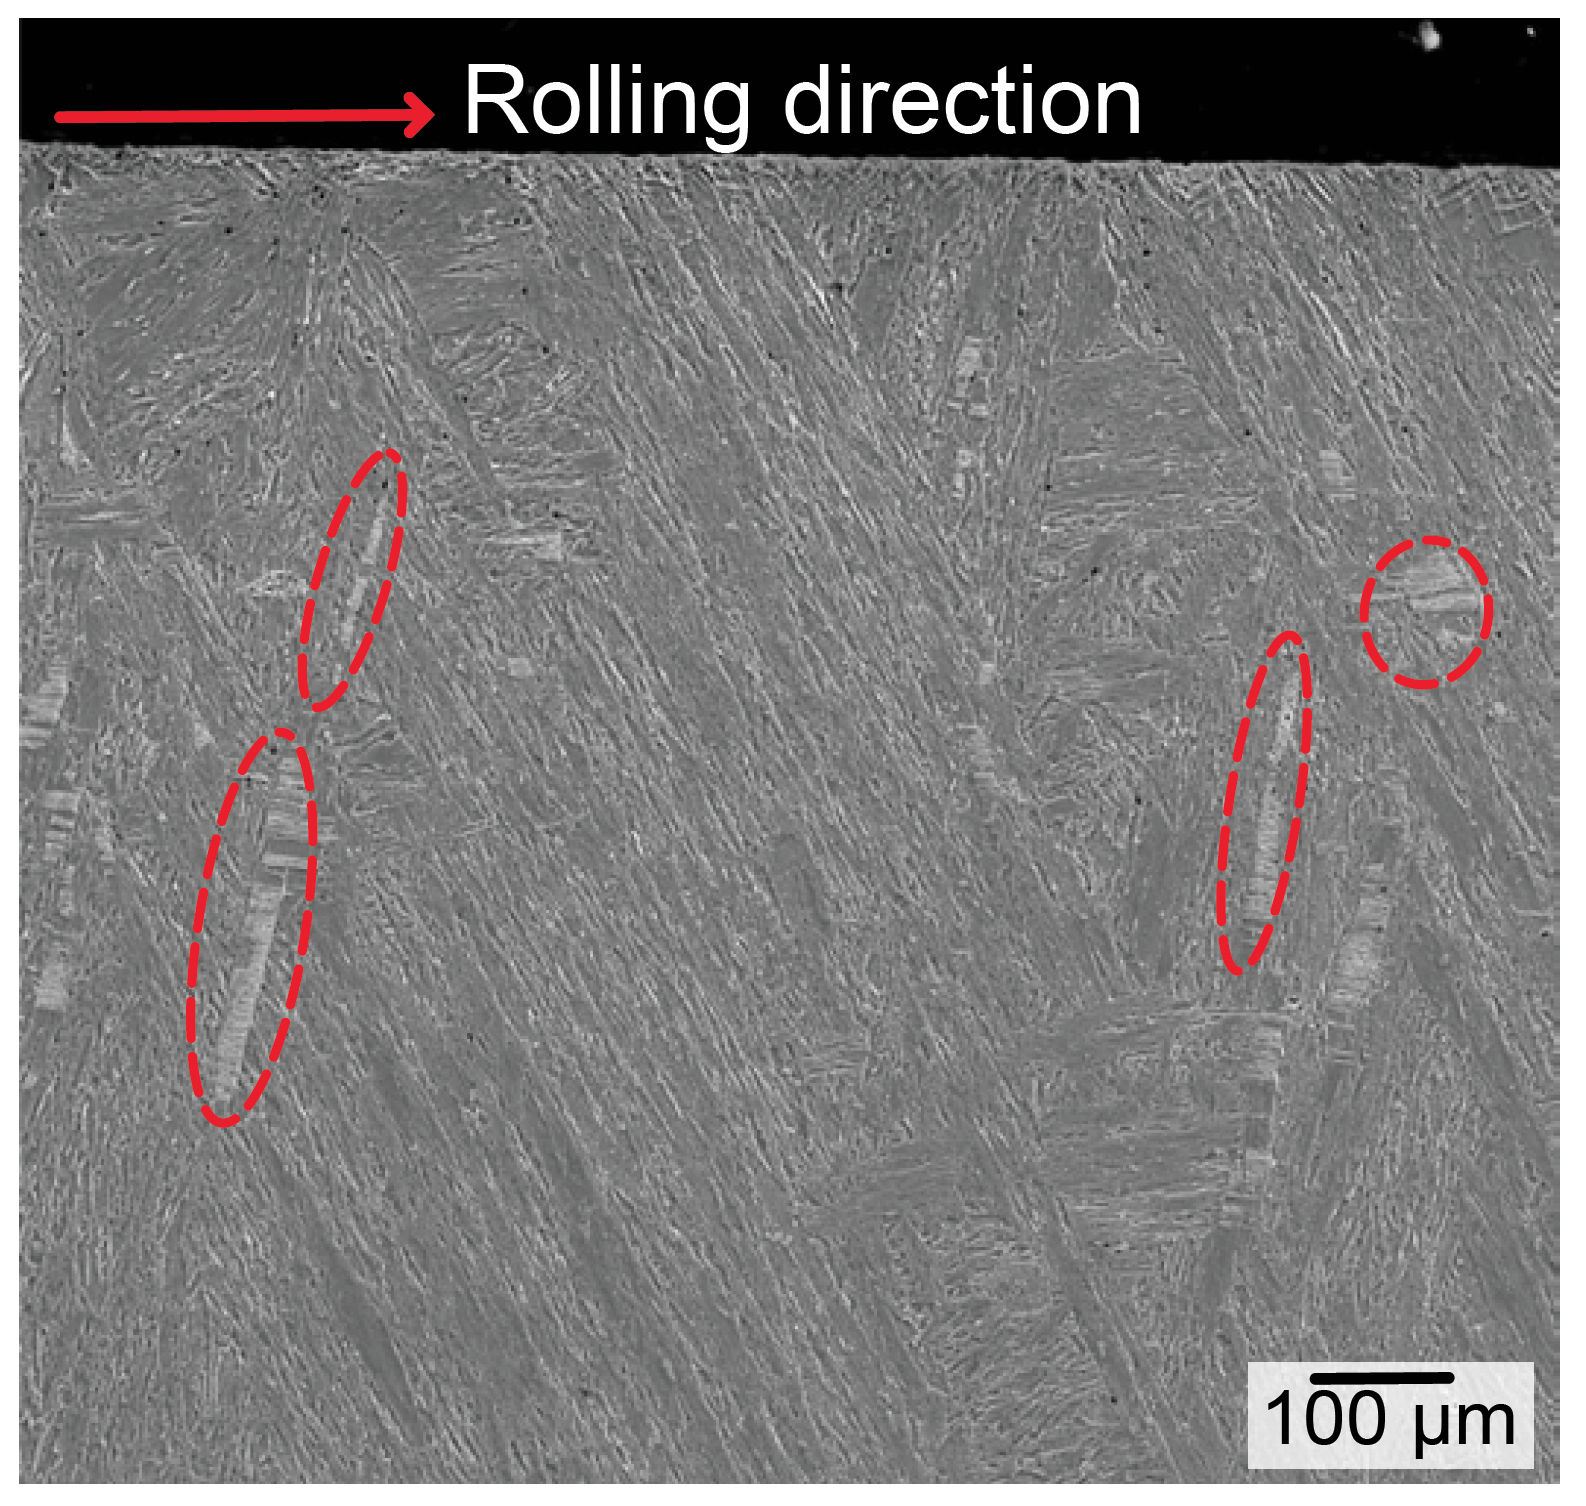
Figure 8—Microstructural decay of Hybrid Steel 60 was observedin the CS and close to the contact surface after RCF at 1.0 Å~ 108stress cycles; the red ovals highlight the decayed microstructure(ferrite microband).
Figure 8(a)(b) shows a lower magnification image of the microstructure in Hybrid Steel 60. The microstructural decay is indicated by the ellipses with a red dashed line. Not all martensitic laths contain ferrite microbands after RCF, which indicates ferrite microbands mainly form in preferred crystal orientations during RCF, i.e., in the martensite lath that is favorably oriented concerning the stress exerted during RCF.
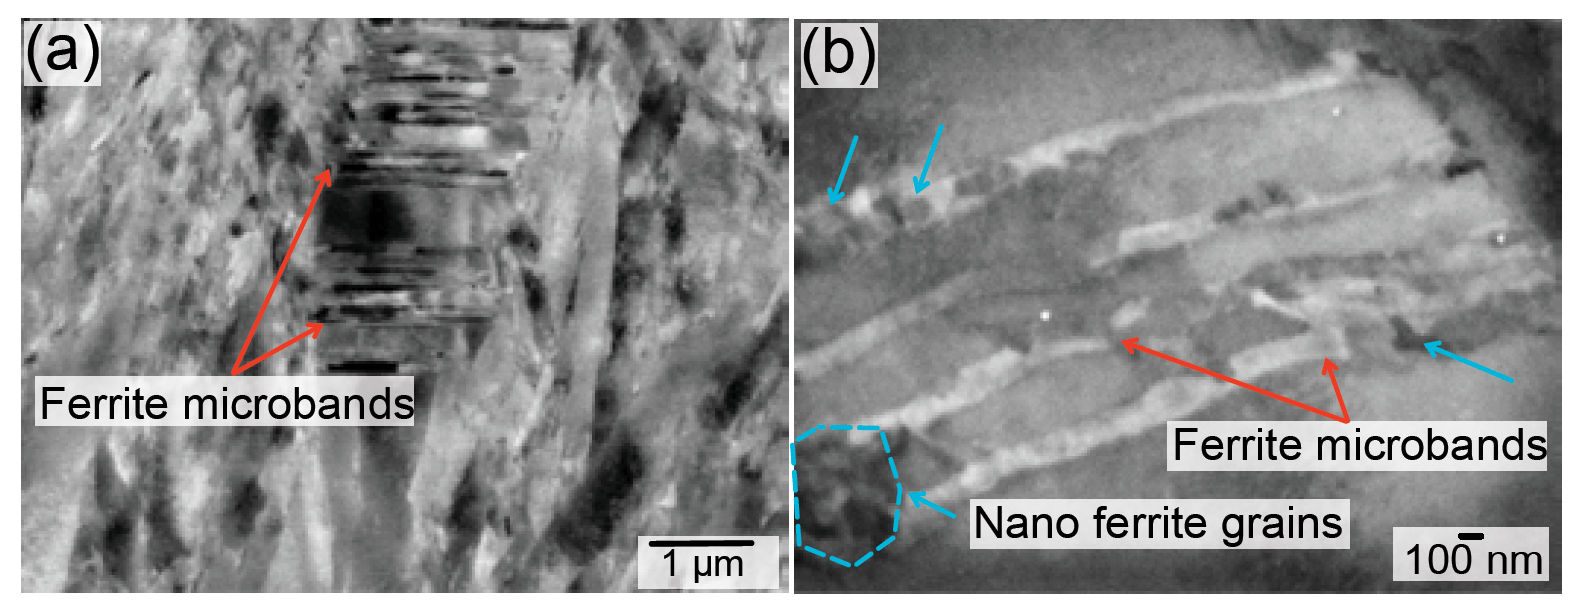
Figure 9—The microstructural decay of Hybrid Steel 60 after RCF, at 1.0 × 10⁸ stress cycles in the CS, obtained at a depth of 60 μm from the contact surface with SEM/BSE imaging. (a) Ferrite microband formation across martensite lath. (b) Nano ferrite grains + ferrite microbands. This sample is not etched.
Figure 9(a)(b) shows the formation of parallel bands within martensite laths known as ferrite microbands. Some nano-sized ferrite grains are also formed adjacent to the ferrite microbands. The ferrite microbands have a size of 150 ± 28 nm and appear to form within the martensite laths that are favorably oriented for slip.
Figure 9(b) shows that the tempered martensite is replaced by the formation of ferrite microbands and nano ferrite grains (encircled with the yellow dashed line). The microstructure decay observed here is similar to that found during RCF in the 52100 steel, which the rearrangement of dislocations can explain due to cyclic microdeformation.
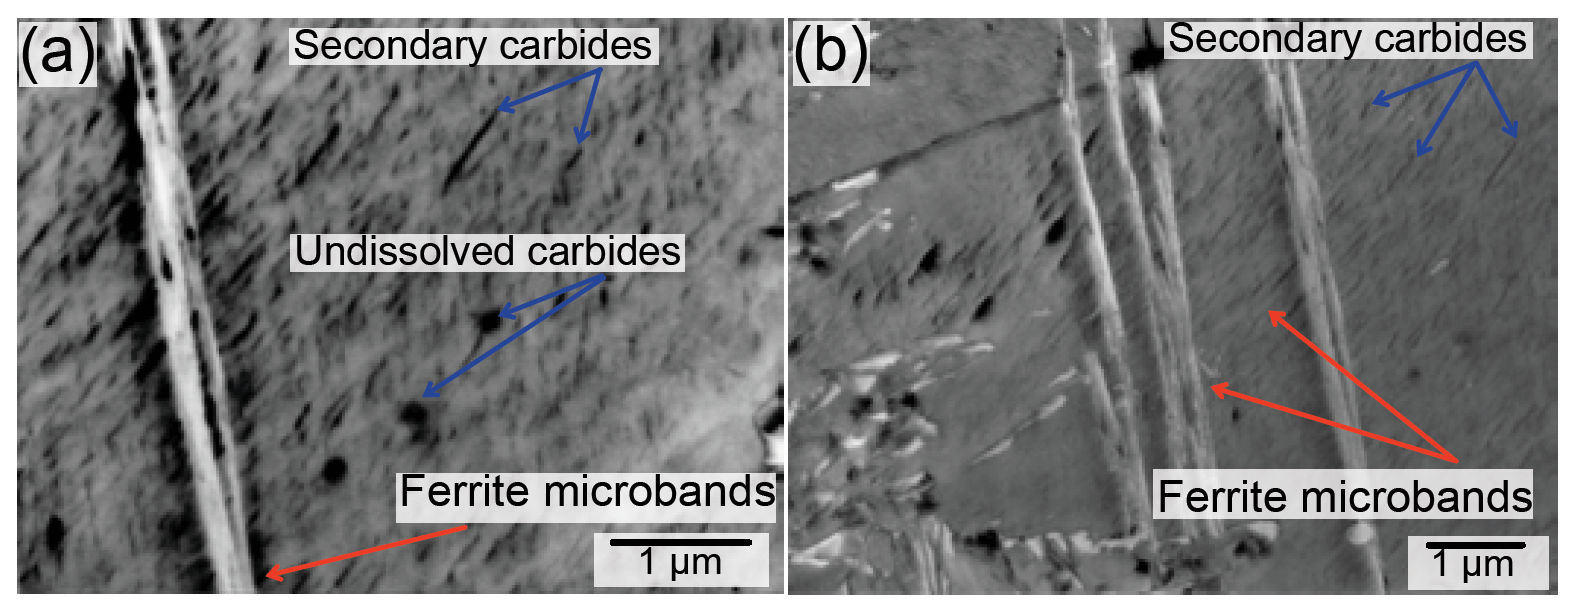
Figure 10—Microstructural decay n the Hybrid 60 steel in the CS at a depth of 60 μm beneath the raceway surface. (a)SEM/BSE image of ferrite microbands, surrounded by secondary carbides. (b) SEM/SE image of secondary carbides.
Figure 10(a)(b) illustrates the presence of secondary carbides within the martensite laths, as well as ferrite microband formation in Hybrid Steel 60 after RCF. The results show that the secondary carbides remain undissolved within the martensite lath region close to the ferrite microband, indicating their high mechanical stability. This is the critical factor for the material’s high decay resistance. Alloy carbides exhibit high thermodynamic stability, making them less susceptible to dissolution due to dislocation movement and variations in dislocation density.
Comparison of Microstructural Decay in Hybrid Steel 60 and 52100 Steel
Quantification
A comparison of the different microstructural decay is shown in Figure 11a-b and Figure 12a.
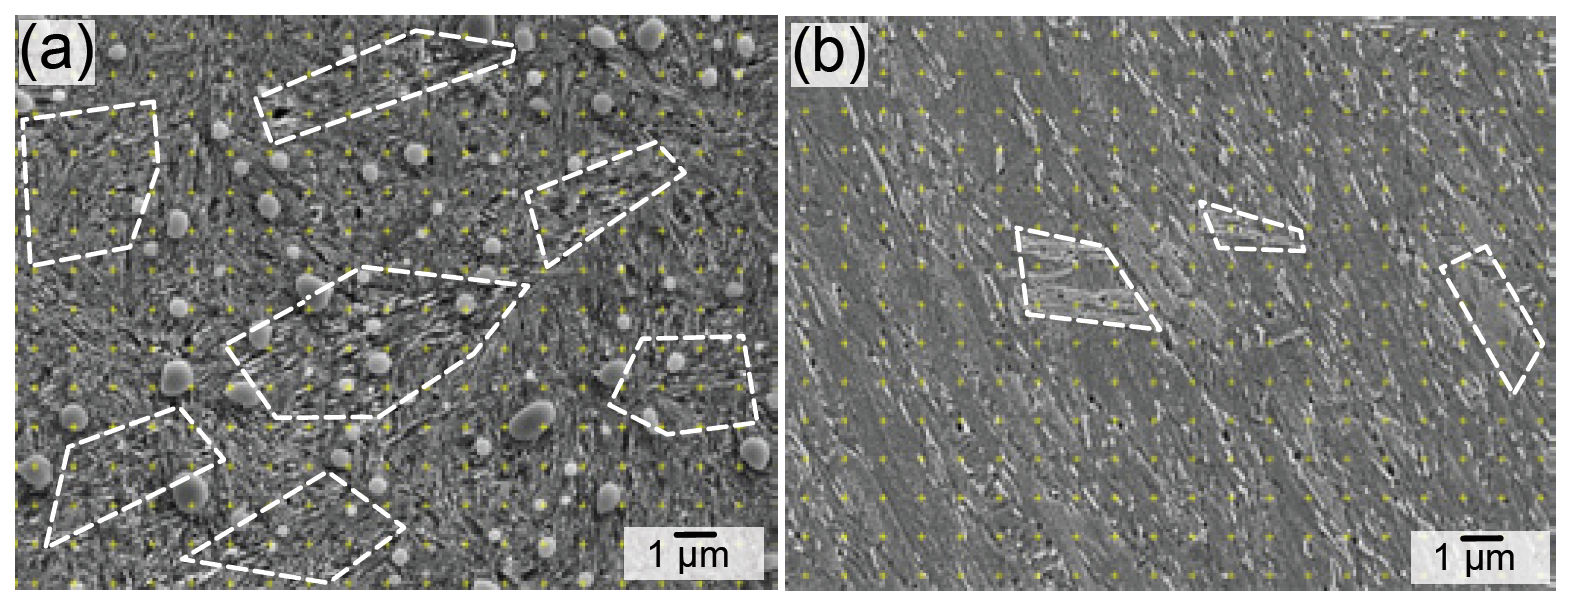
In Figure 11, the area encircled by the dashed white lines shows examples of decayed microstructure. In these areas, elongated ferrite, ferrite microband, and nano-sized equiaxed ferrite can be observed.
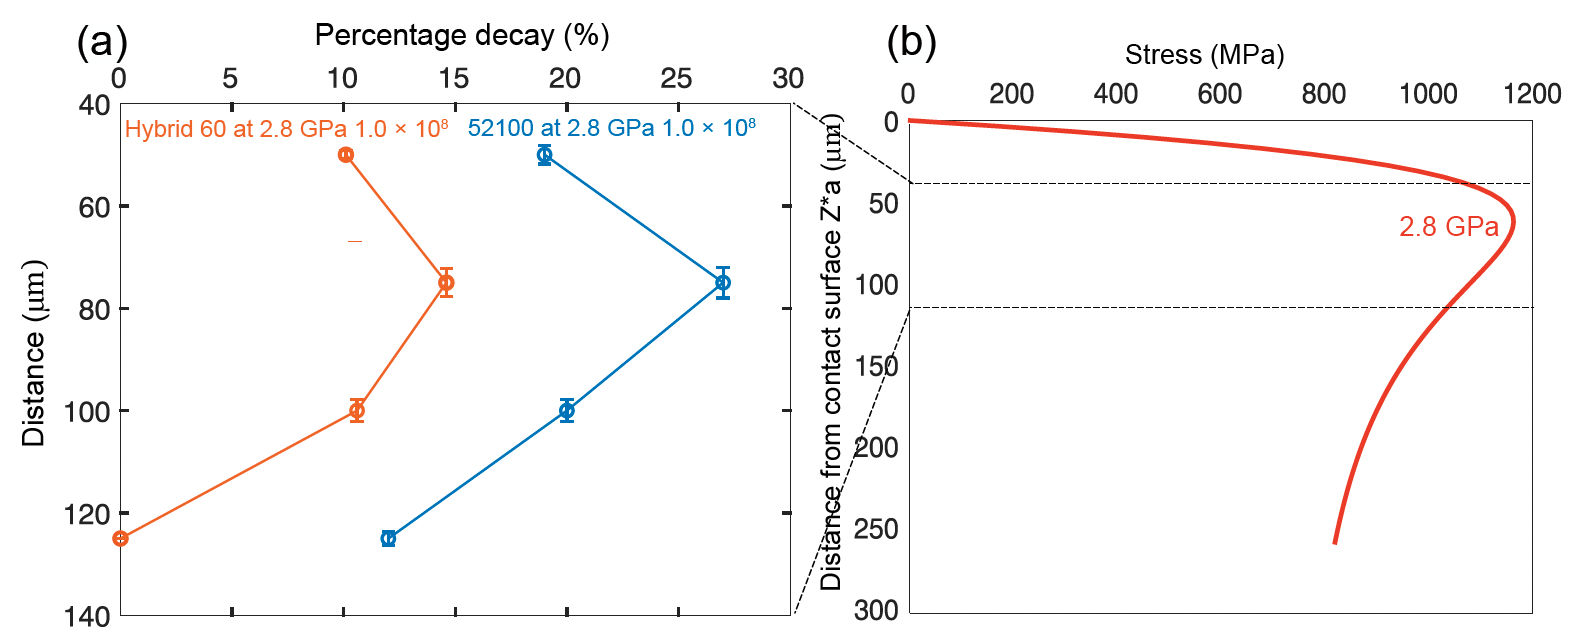
Figure 12(a) shows the change in the area percentage of microstructural decay from the contact surface toward the interior of the sample. The shear stress distribution across the depth calculated using Hertz theory is also shown in Figure 12(b).
Figure 11—SEM/SE image of microstructural decay in the region of maximum shear stress after 1.0 × 10⁸ stress cycles, in the radial section at 75 μm from the raceway surface). (a) 52100 steel. (b) Hybrid Steel 60.Figure 12—(a) The effect of distance from the surface on the percentage of microstructural decay for 52100 steel and Hybrid Steel60. (b) The calculated shear stress along the center line of rolling contact. Region of maximum shear stress is indicated.
The microstructural decay increases with the depth from the surface, having a maximum value between the depths of 75 and 100 µm, where the Hertzian stress is the highest during RCF. The percentage of microstructural decay is also higher for 52100 steel than for Hybrid Steel 60.
Hardness
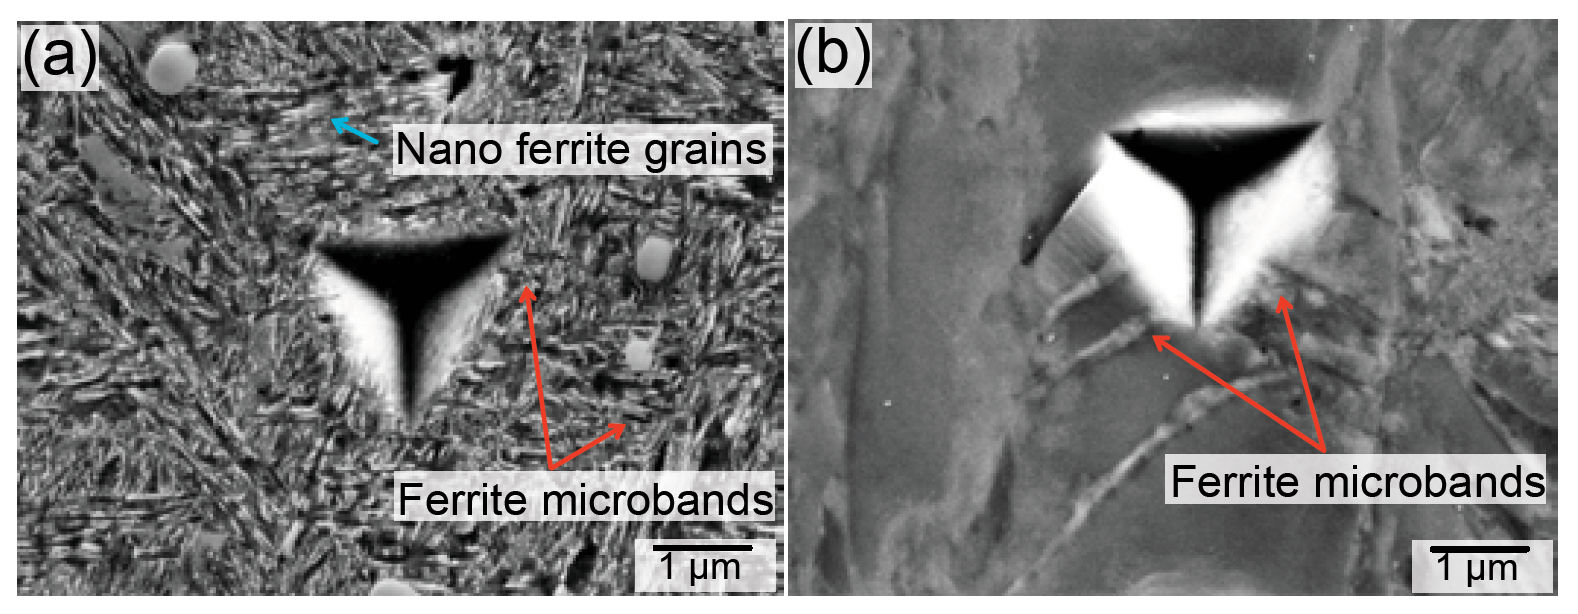
Figure 13a shows SE micrographs of the hardness testing indents in the decayed microstructure with elongated and equiaxed ferrite in 52100 steel. These areas have a hardness of around 7.3 ± 0.45 GPa. Figure 13b shows an indent on the ferrite microband within the martensitic lath structure of Hybrid Steel 60 steel. The hardness here is 9.03 ± 0.43 GPa.
Figure 13—Nanoindentation in the region of maximum shear stress at 1.0 × 10⁸ stress cycles, measured in the radial section sample and at the depth of 75 μm from the raceway surface. (a) SEM/SE image of an indent in the microstructural decay region (yellow arrows) observed in 52100 steel. (b) SEM/BSE image of an indent in ferrite microbands in Hybrid Steel 60.
The elongated ferrite in the 52100 steel has a lower hardness compared to the virgin matrix (8.73 ± 0.18 GPa), and the Hybrid Steel 60 has a slightly higher hardness in the ferrite microbands compared with the virgin matrix (8.12 ± 0.19 GPa).
It should also be noted that the Hybrid Steel 60 has a slightly lower hardness in areas with nano ferrite grains. The hardness here was 6.61 ± 0.44 GPa, and it indicates that localized softening will occur for materials that tend to form nano ferrite grains after stress cycling. The results of the nanohardness measurements are shown in Table 3 and Table 4.
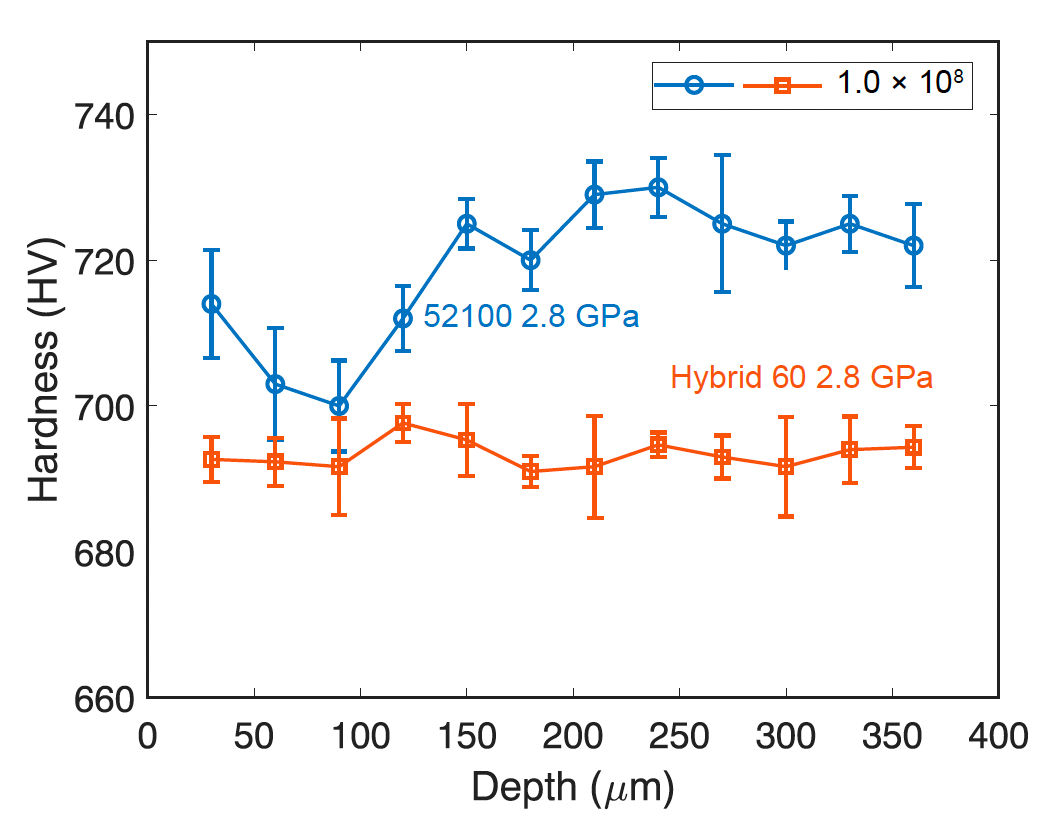
Figure 14—Micro-Vickers hardness (HV) values obtained from Knoop measurement from the radial section sample after RCF testing for 1.0Å~ 108 stress cycles.
Figure 14 shows the hardness profile for the two materials after RCF for 1.0 × 10⁸ stress cycles. The 52100 steel shows a softening in the region of maximum shear stress (between 40–130 µm from the surface), with a hardness value of 700 ± 15 HV. However, no change of hardness was observed in the region of maximum shear stress for Hybrid Steel 60. This indicates that Hybrid Steel 60 has more resistance toward softening during RCF.
The reason for the drop in hardness in 52100 at the region of maximum shear stress is that this steel experiences higher cyclic softening due to the dissolution of cementite, including both residual and tempered cementite. This is illustrated in Figure 6(a)(b). This process occurs through the intersection of residual cementite by elongated ferrite, as well as the accumulation and interaction of dislocations at the interface between the cementite and the matrix. This aligns with findings from various previous researchers, which suggest that the binding energy between carbon atoms and the dislocation core is greater than the bonding between carbon and iron atoms in cementite.
In contrast, the reduced cyclic softening observed in Hybrid Steel 60 is attributed to the increased resistance towards dislocation rearrangement (and the formation of ferrite microband and elongated ferrite) during RCF. This is related to the increased stability of NiAl and resistance of secondary carbides to dissolution during RCF.
Conclusions and Further Work
This research program focused on using various characterization techniques to investigate the damage behavior of Hybrid Steel 60 and 52100 steel when subjected to rolling contact fatigue (RCF).
In precipitation-strengthened steels like Hybrid Steel 60, the presence of carbides and NiAl precipitates effectively inhibits the formation of dislocation cell structures, which typically cause microstructural softening in other martensitic steels such as 52100. Although partial dissolution of NiAl precipitates occurs, there is a reduced tendency for dislocation rearrangement. Our analysis demonstrated that 52100 steels exhibit a greater degree of microstructural decay compared to Hybrid Steel 60. This difference is attributed to the higher stability of precipitates in Hybrid Steel 60 under similar stress loading conditions, contributing to its enhanced resistance.
The indications are that Hybrid Steel 60 may be better suited for special bearing applications where corrosion and hydrogen resistance are required, as 52100 does not offer these additional properties. However, future work is needed to clarify the relationship between microstructural decay and fatigue crack initiation.
Another important area of research will be Tribo-corrosion fatigue testing to evaluate the impact of water-based lubricants that could potentially emerge as the leading environmentally friendly lubricant in a wide range of applications, including electric vehicles (EVs) and offshore applications.
Further Reading and References
The full results of this research program, as well as references to other work and a bibliography, can be found in Tania Loaiza Uribe’s doctoral thesis with the KTH Royal Institute of Technology:
“Microstructural Decay in High-Strength Bearing Steels under Rolling Contact Fatigue.”
[advertisement]
×
Like What You see?
Power Transmission Engineering is THE magazine of mechanical components. PTE is written for engineers and maintenance pros who specify, purchase and use gears, gear drives, bearings, motors, couplings, clutches, lubrication, seals and all other types of mechanical power transmission and motion control components.
*Unsubscribe any time. Full details in our privacy policy


 Power Transmission Engineering is THE magazine of mechanical components. PTE is written for engineers and maintenance pros who specify, purchase and use gears, gear drives, bearings, motors, couplings, clutches, lubrication, seals and all other types of mechanical power transmission and motion control components.