How To Replace Oil as a Lubricant in Worm Gearboxes With Grease
For worm gearboxes, oils are mainly used in combination with splash lubrication. Consistent lubricants, such as greases, are used less frequently and are used, for example, in gearboxes where it is not possible or difficult to seal the housing (Ref. 1). These applications include positioning gears, but also power gears with high sealing requirements, such as in the food industry. Grease lubrication has, in comparison to oil, a negative thermal effect on the worm, resulting in higher mass temperatures (Ref. 2). However, this effect becomes less relevant in the application of positioning gears, so that the advantages of grease lubrication outweigh the disadvantages in these applications.
At certain operating points, consistent lubricants also offer additional advantages over the more common oil lubrication. For example, in worm gears with low rotational speeds and sliding speeds, friction and wear can be reduced when using grease instead of oil (Ref. 2).
Grease lubrication places different demands on the calculation and design of gearboxes than oil lubrication. This applies to both the housing design and the design of the gearing. In terms of rheological behavior, grease can be described as a non-Newtonian fluid, which means that the viscosity varies with the shear rate. To describe this behavior, there are various models available, such as the power law or the Bingham model. These models assume a solid behavior of the lubricant at low shear rates and viscous behavior at higher shear rates (Ref. 3). In contrast to oil lubrication, there are currently no calculation methods available for predicting friction in grease-lubricated worm gears. Such a physically based calculation method for friction in a grease-lubricated tooth contact enables application-specific gear design and optimization regarding friction reduction.
This work presents the foundation for calculating the friction in the worm gear contact, which is the main difference between calculating the efficiency for gearboxes with oil and grease lubrication. The presented investigation includes the determination of boundary friction as well as the calculation of the film thickness, which is essential for the relationship between boundary friction and fluid friction. The combination of these two friction calculations represents the mixed friction conditions that are present in the tooth contact of worm gears. The calculation methods will be presented exemplarily for one grease.
In addition to those investigations regarding the calculation of the friction, the grease distribution inside the gearbox will be researched by using fluorescent particles. The grease distribution is a key factor for the gearbox design to avoid starvation in the tooth contact. The results will be presented for two different greases, which are different than the one used for the calculation methods. Although one of them is grouped in the same NLGI class as the grease used for the analytical description, according to Ref. 4, the main goal regarding the grease distribution is to avoid dead spaces and to create a good mixing of the grease.
Summarizing this paper answers the question “How to replace oil as a lubricant in worm gearboxes with grease?” with two different approaches. On one hand, an approach for an analytical calculation method is presented, and in addition to that, experimental investigations on the practical design of the gearbox are shown.
Grease lubrication in worm gearboxes is only little researched so far in contrast to the area of rolling bearings, where grease lubrication is widespread (Ref. 3). Monz showed with an experimental approach the potential for grease lubrication with a wide range of different greases and operating conditions of the worm gear showing upsides compared to oil lubrication in different areas (Ref. 2).
For worm gears, there is no physically based calculation method for friction in the grease-lubricated tooth contact available, which is necessary for application-oriented gearbox design as well as for the optimization concerning friction reduction. Because of this lack of tools to design worm gearboxes for grease lubrication, most gear manufacturers use the design of the gearboxes for oil lubrication and simply fill them with grease. This working method is sufficient to achieve the goal of high sealing requirements, but neglects the potential for optimization.
The calculation methods used for rolling bearings, for example, to determine the rating life according to (Ref. 5), use a simplification to calculate the film thickness for grease lubrication. The calculation of this value for oil lubrication is well researched and broadly used, for example, through the equations by Hamrock and Dowson (Ref. 6). To determine it for greases, common sense in the practical calculation is to use the properties of the base oil of the grease and calculate the film thickness according to the model for oil lubrication. This method is, around high sum velocities, appropriate because the film thickness of grease converges to that of its base oil with increasing sum velocity (Ref. 7).
Nevertheless, there are approaches to describe the film thickness of grease lubrication in a more detailed way, again with the background of lubrication in rolling bearings. Morales-Espejel et al. present a different way to describe the dynamic viscosity of the grease, in contrast to just using the viscosity of the base oil. They determine an experimental correction factor that is applied to the base oil viscosity and depicts the behavior of the grease in a more precise way. The factor depends on the sum velocity and converges to the viscosity of the base oil with increasing speed, because of the converging behavior of the film thickness from the grease to the oil. This adapted viscosity can later be used in the existing formulas for calculating the film thickness for oil lubrication (Ref. 7).
Another alternative calculation method is presented by Cousseau et al., where the properties of the bleed oil of lubricating greases are used. The film thickness measurements on a ball-on-disk tribometer showed that the behavior of the bleed oil differs from the base oil and is more comparable to the actual grease. Their suggestion for the calculation of grease film thickness is to use the properties, mainly the dynamic viscosity of the bleed oil instead of the base oil, to get a better match to the actual behavior of the grease (Ref. 8).
Friction in the Tooth Contact
The analytical description of the friction in the tooth contact consists of the description of boundary friction combined with fluid friction. The approach used for determining these two frictions is different from each other, as shown in the existing model for oil lubrication described in Ref. 9.
Boundary Friction
The boundary friction is calculated by using a characteristic diagram, which is determined with a two-disk test bench for every grease under various operating conditions. The overall setup of the testbench, as well as its functionality and the execution of the test, is described in Ref. 10. The varied parameters to achieve different operating conditions are shown in Table 1. The low sum velocity and the high slide-to-roll ratio SRR (up to 100 percent) can be explained by the conditions in the worm gear contact, as shown in Ref. 9, and these circumstances are modelled with the given parameters on the two-disc testbench. The two discs are analogous to the materials used in worm gears, made of bronze and steel. In a worm gearbox, the worm is usually made of steel, and the worm wheel is made from bronze.
Parameter
Value
Sum velocity
0.2 m/s
Slide-to-roll ratio (SRR)
0 - ±100 %
Temperature
20 °C, 50 °C, 80 °C
Contact pressure
386 MPa, 582 MPa, 802 MPa
Lubricant quantity
0.5 ml
Repetitions
3
Table 1—Parameters two-disc test bench.
During the tests, different coefficients of friction were determined for positive and negative slide-to-roll ratios (SRR). The difference between positive and negative SRR results from the different speed distribution of the two discs. Investigations with positive SRR were made with the steel disc rotating faster, and the values for negative SRR were determined with the bronze disc rotating faster. The primary focus during this investigation is on the values for positive SRR, which means that the steel disc is rotating faster. This condition is the main use case in real worm gear boxes because the worm is rotating faster than the wheel. The used grease is classified according to Ref. 4 into NLGI class 1, and its base oil viscosity amounts to 680 cSt.
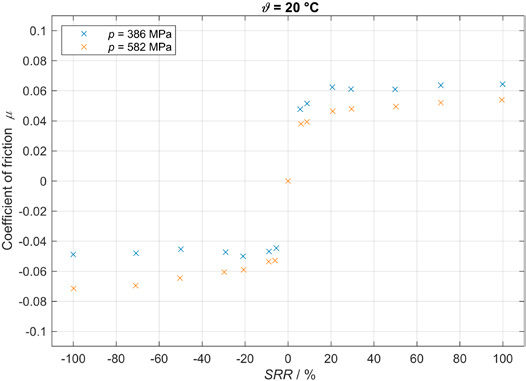
During the tests, traction curves are determined for various temperatures and pressures, resulting in a characteristic diagram for the examined grease. As an example, Figure 1 shows the traction curves of the examined grease at 20°C with two investigated contact pressures.
Figure 1—Traction curves for p = 386 MPa and 582 MPa at 20°C.
[advertisement]
The traction curves show a temperature and pressure-dependent behavior of the grease regarding the coefficient of friction. There is also a visible difference between the states of positive and negative SRR. The measured coefficients of friction with the bronze disc rotating faster are higher than those with a faster-rotating steel disc. A possible explanation for this effect is the rolling friction, which always works in the same direction, regardless of the sliding friction. The effect that the coefficient of friction in the area of positive SRR decreases with higher pressure can potentially be explained by a thinning effect on the grease, resulting in lower fluid friction.
Effect of Preshearing on the Coefficient of Friction
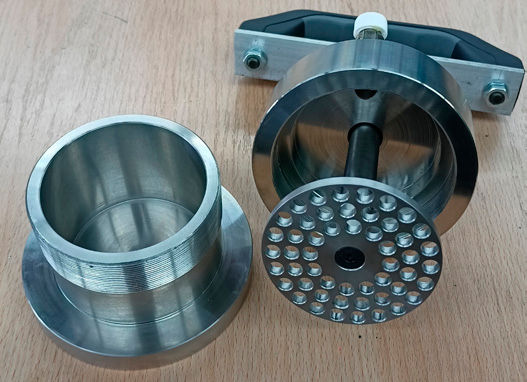
During the experiments on the two-disk test bench, the effect of preshearing on the coefficient of friction was investigated. To research this behavior, the coefficient of friction was measured using two different states of the examined grease. In the first state, the grease was not conditioned beforehand and was directly applied to the two discs. For the second state, the grease was sheared using a kneader for grease according to DIN 2137 (Ref. 11). The kneader used for this investigation is shown in Figure 2.
Figure 2—Kneader for grease according to DIN 2137 (Ref. 11).
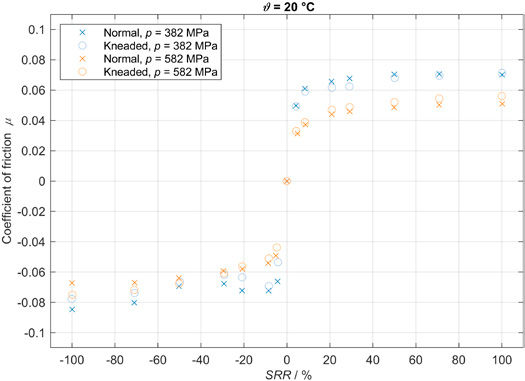
The determined traction curves for the two different states of the examined grease are shown in Figure 3, this time showing the results of an alternative grease in contrast to Figure 1. In this diagram there is again the difference between the values for positive and negative SRR. But in contrast to that the difference between the normal and the kneaded state of the grease is very small, especially in the area of positive SRR.
Figure 3—Traction curves for p = 386 MPa and 582 MPa at 20°C with different states of the alternative grease.
Film Thickness in the Tooth Contact
To determine the share between fluid and boundary friction, the lubricating film thickness is a key indicator. To describe the film thickness of the grease more precisely than the approximation with only the properties of the base oil, both additional methods presented in the state of the art will be investigated in this work. The investigation will take an eye on the applicability of these calculation methods on the examined grease.
Determination of Lubricant Parameters
Both examined calculation methods require the dynamic viscosity of an oil from the grease, either from the base oil or from the bleed oil. Since these viscosities are not provided by the manufacturer of the lubricant, the viscosities of both oils were measured using a high-pressure viscometer.
Extraction of the Bleed Oil
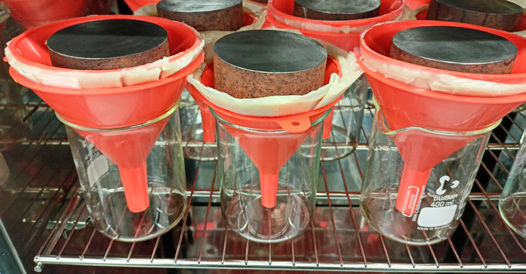
Bleed oil refers to the oil in a grease that is “bled” out under load. To determine the properties of this oil, it must first be extracted using a filter method based on the principle in Ref. 12. Therefore, the grease was placed in a filter and then subjected to a static load for a longer period of time. A pleated filter made of cellulose with a retention capacity of 7–9 µm was used and placed in a plastic funnel. The grease was then distributed along the walls of the funnel, and a second funnel was used to apply the load evenly. The load was applied using a disk with a weight of 1 kg, which was placed in the second funnel. The entire combination of funnels, grease, and weight was then placed on a beaker to collect the bleed oil. To speed up the extraction process, the entire assembly was then placed in an oven at a constant temperature of 70°C. In this way, approx. 15 ml of bleed oil per funnel assembly could be obtained over a period of 5 days. The structure in the oven is shown in Figure 4.
Figure 4—Structure for the extraction of the bleed oil.
Measurements on the High-Pressure Viscometer
The measurements to determine the lubricant parameters were conducted using a high-pressure viscometer. The design of the device and the mode of operation of the viscosity measurement are explained in Ref. 13. The measuring principle of the viscometer is based on a falling body, which sinks downwards due to gravity in a tube filled with fluid, whereby the fluid is tempered and pressurized. During the experiment, the falling time of the body is measured, and the viscosity is determined based on this information. The longer this time is, the slower the body sinks in the fluid and the greater the viscosity. The temperatures assessed were 20°C, 40°C, 60°C, 80°C, and 100°C at ambient pressure, 200 MPa and 400 MPa, respectively. In the evaluation, the viscosity is determined using Equation 1 (Ref. 13):
(1)
where
C is a correction factor;
t is the measured time of the falling body;
υ is the temperature;
η is the dynamic viscosity;
p is the pressure;
ρ is the density of the lubricant / falling body.
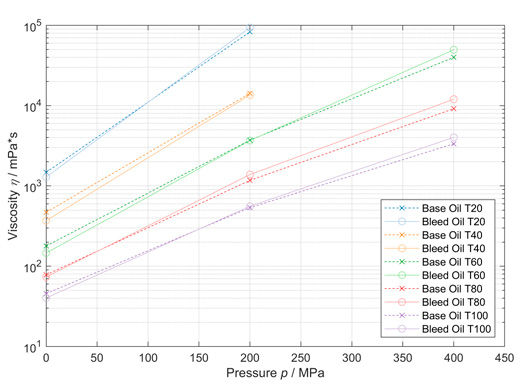
The resulting dynamic viscosities for the various operating points are shown in Figure 5. The measured viscosities show a visible difference between the bleed oil and the base oil, indicating that these two lubricants are not identical. This is an expected result and matches the observations regarding bleed oil and base oil present in Ref. 8, where differences between the oils were also found. As an example, the difference between the viscosity of both oils at 400 MPa and 80°C is 31 percent of the viscosity of the base oil. The standard deviation at this point is 0.8 percent for the base oil and 0.7 percent for the bleed oil. This shows that the measured difference results from the lubricant properties and is not an outcome of the measurement principle. Furthermore, it is noticeable that the viscosity of the bleed oil increases more with increasing pressure than that of the base oil, which indicates the pressure viscosity coefficient αp of the bleed oil is higher than that of the base oil. Currently, there is no explanation for this behavior, and the effect will be subject to further investigations in the future. It is important to check whether this effect occurs with other lubricants as well.
Figure 5—Measured dynamic viscosities for bleed and base oil.
Determination of Viscosity Parameters
Based on the measured viscosities, there can be specific parameters determined to calculate the dynamic viscosity of a lubricant in dependence on the pressure and the temperature. For this calculation, Equation 2 is used according to Ref. 14:
(2)
where
υ is the temperature;
η is the dynamic viscosity;
p is the pressure.
The three parameters K, B, and C are calculated by Equations 3–5 according to Ref. 15:
(3)
(4)
(5)
The remaining four parameters a1 , a2 , b1 and b2 are determined afterwards by nonlinear regression. For this purpose, the measured viscosities as well as the corresponding pressure and temperature are used and the system of equations for the parameters is solved. With the parameters determined in this way, the viscosity can now be determined for the oils under investigation at any pressure and any temperature, which makes it possible to estimate the lubricating gap height for any operating points.
Film Thickness Measurement
To rate the applicability of the different calculation methods for the examined grease, the film thickness is measured under different operating conditions using a ball-on-disk tribometer. The used device is the high-speed tribometer “EHD-HS” by PCS Instruments, which determines the film thickness using interferometry and enables measurements at speeds of up to 20 m/s. A brief description of the device and the measuring principle can be found in the manufacturer’s brochure (Ref. 16). A total of three temperatures and 31 different speeds at a constant contact pressure were selected for the measurements. The overview of the test parameters is shown in Table 2.
Parameter
Value
Velocity
0.01 m/s to 2 m/s (31 Data points)
Temperature
30 °C, 45 °C, 60 °C
Contact pressure
531 MPa
Table 2—Parameters ball-on-disc tribometer.
As worm gearboxes have very low local sum velocities in contact, the measurements on the tribometer were also primarily conducted at low speeds, with a speed of 0.01 m/s representing the lower limit of the measuring device. This speed is the sum speed, which consists of the sum of the disk speed and the ball speed at the contact point. There is no slip during the tests, which means that the relative speed in the contact is zero. During a measurement, the speed is then successively increased at logarithmic intervals, and a value for the central film thickness is determined at each operating point. The measurement for this is repeated a total of five times, and the result for the film thickness is formed by the mean value from the five measurements. Similar conditions were selected for the temperature as for the tribometer tests on boundary friction to analyze similar operating points. The temperature of 30°C represents the lower limit of the measuring device in our specific setup, as this value depends on the temperature of the room in which the tribometer is set up. The considered contact pressure of 531 MPa results from the combination of a pressure close to the application and the stress limit of the glass disc of the tribometer, which is 700 MPa. A certain degree of safety was considered here, with which a realistic pressure value in the tooth contact was nevertheless investigated.
Figure 6—Film thickness measurements for grease and oils.
The results of the film thickness measurement at 60°C are presented in Figure 6. The results show clear differences between the film thickness of the lubricating grease and the corresponding oils. In areas of low speed, the film thickness of the grease is significantly higher than that of the oils, and it converges with increasing sum velocity. In contrast to that, the film thickness of the bleed oil and base oil is fairly similar to each other. The small excerpt shows the film thickness of the bleed oil and base oil in a more detailed view, and with the addition of error bars. These graphs show that the difference between the oils does not come from measurement accuracy and that they have different lubricant properties, like the viscosity measurements.
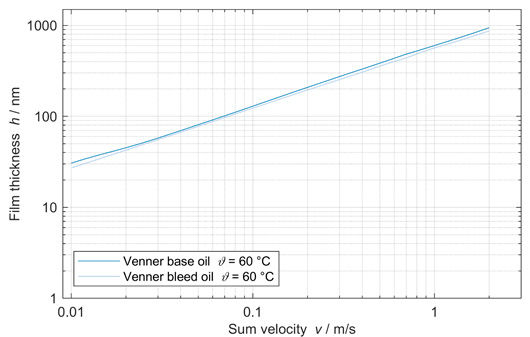
To further analyze the difference between the lubricant properties of the bleed oil and base oil, Figure 7 shows the calculated central film thickness for both oils according to Equation 6, which will be further explained in the section “Grease Film Thickness.” The needed lubricant parameters were taken from the viscosity measurements shown in the section “Determination of Viscosity Parameters.” The visible results of the calculation show a good match to the experimentally determined values of the film thickness, and the values for bleed oil and base oil are again fairly similar to each other. Furthermore, the calculated film thickness of the bleed oil is lower than that of the base oil, as well as in the experimental results. This difference mainly comes from the lower viscosity at ambient pressure, η0, which can be seen in the result of the viscosity measurement in Figure 5. The calculated values suggest that the higher pressure viscosity coefficient of the bleed oil does not equalize the lower viscosity at ambient pressure, resulting in a lower calculated value for the film thickness.
Grease Film Thickness
To compare the two described analytical approaches to the experimental measurements, the film thickness must first be calculated at the chosen operating points. To calculate the central film thickness, the equation for the elliptical point contact, shown in Equation 6, according to Venner (Ref. 17), was used. This approach is based on the equations of Dowson and Higginson (Ref. 18), and the whole calculation is shown in the appendix.
(6)
The main equation can be used equally for both approaches because the only difference lies in the calculation of the dynamic viscosity of the lubricant. The dynamic viscosity influences the parameters M, L, and Hcen in Equation 6 because it is used for the calculation of the dimensionless velocity parameter U, shown in Equation 16, which is needed for the determination of the three mentioned parameters.
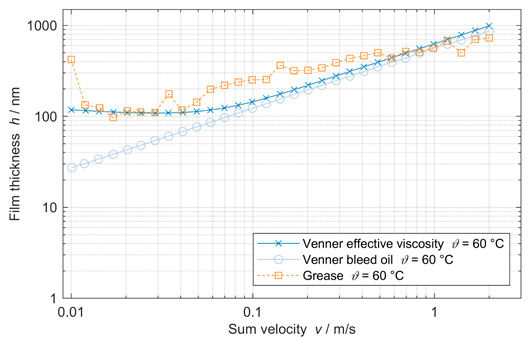
The comparison between the measured film thickness at 60°C and the calculated value with both methods is shown in Figure 8. Here, the values described as “Venner bleed oil” were calculated using the viscosity of the bleed oil according to Ref. 8, and the values named “Venner effective viscosity” were calculated using the correction factors introduced in Ref. 7. The calculation for this effective viscosity is shown in Equation 7.
(7)
The two correction factors A and f are determined by using nonlinear regression for the results of the film thickness measurements of the grease at two striking velocities. The first velocity is the lowest measured speed, but higher than 0.0063 m/s, and the second velocity is the speed at which the behavior of the grease matches that of its base oil. Furthermore, the pressure viscosity parameter αp needed for the film thickness calculation of the grease is obtained from the highest film thickness measurements, where its behavior is close to that of the base oil (Ref. 7).
Figure 7—Calculated film thickness for base oil and bleed oil.
The comparison shows overall that the calculation method using the effective viscosity of the grease fits the measured values at this operating point with this exact grease better than the values determined with the bleed oil viscosity. The difference between the two methods is bigger at lower speeds, and the results converge with increasing velocity to each other as well as to the experimental values.
Grease Distribution
The grease distribution in the gearbox of a worm gear is a key factor for sufficient lubrication of the tooth contact. If the distribution is unfavorable, it is possible that there is not enough lubricating grease in the tooth contact, and the effect of starvation can occur, which leads to increased friction and loss in efficiency. To design the gearbox properly for an optimal grease distribution, it is important to understand the behavior of the grease during operation.
Figure 8—Comparison between measured and calculated film thickness.
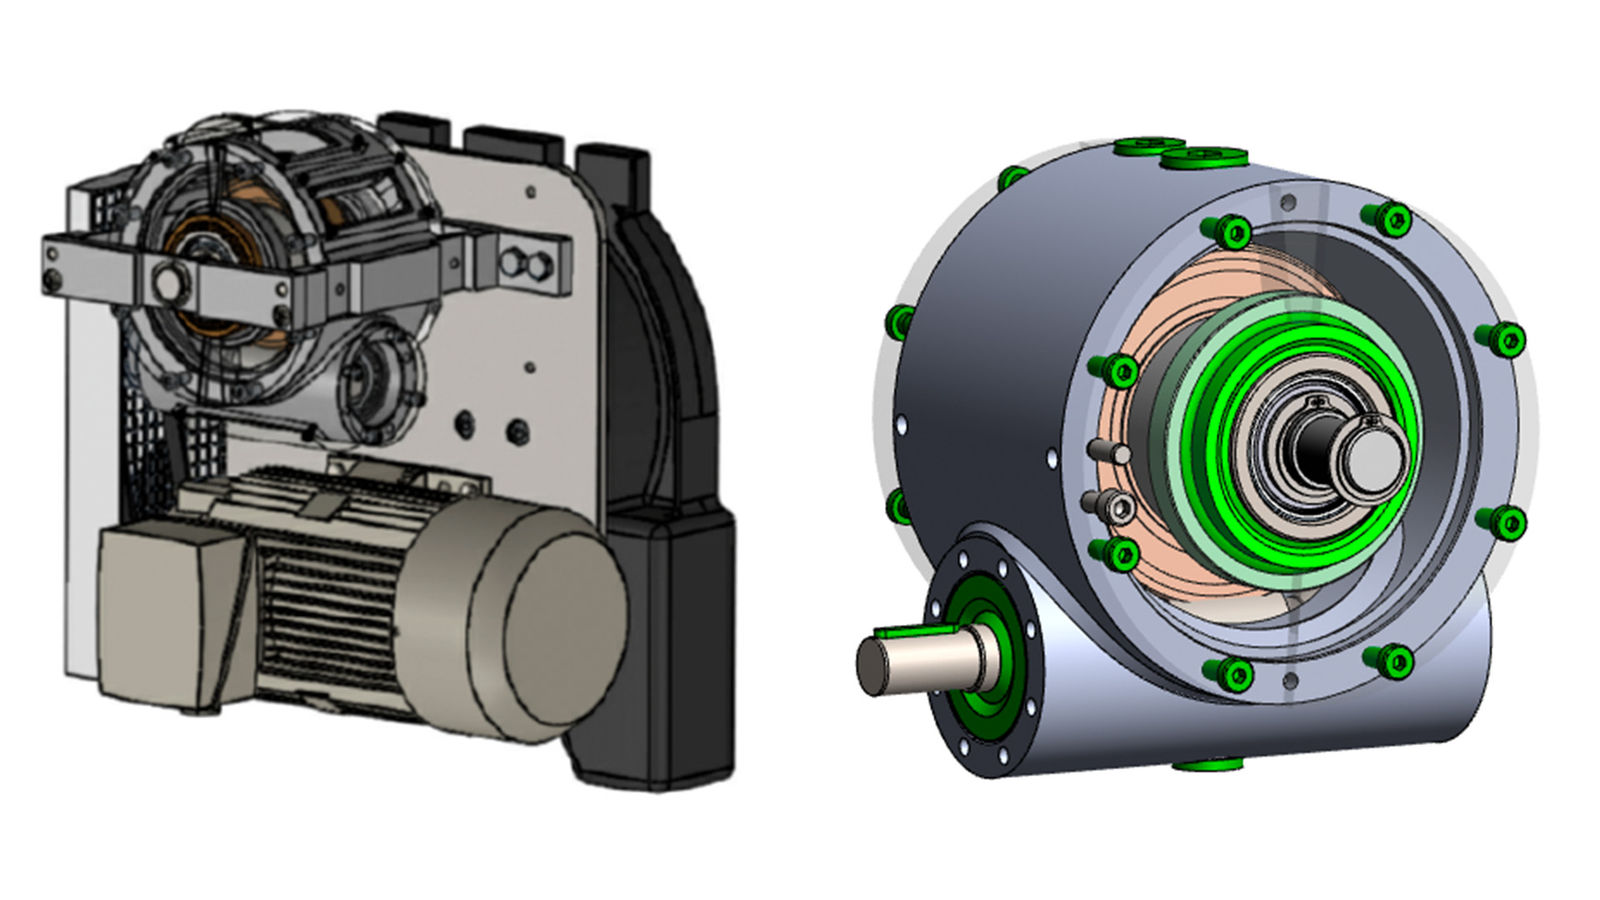
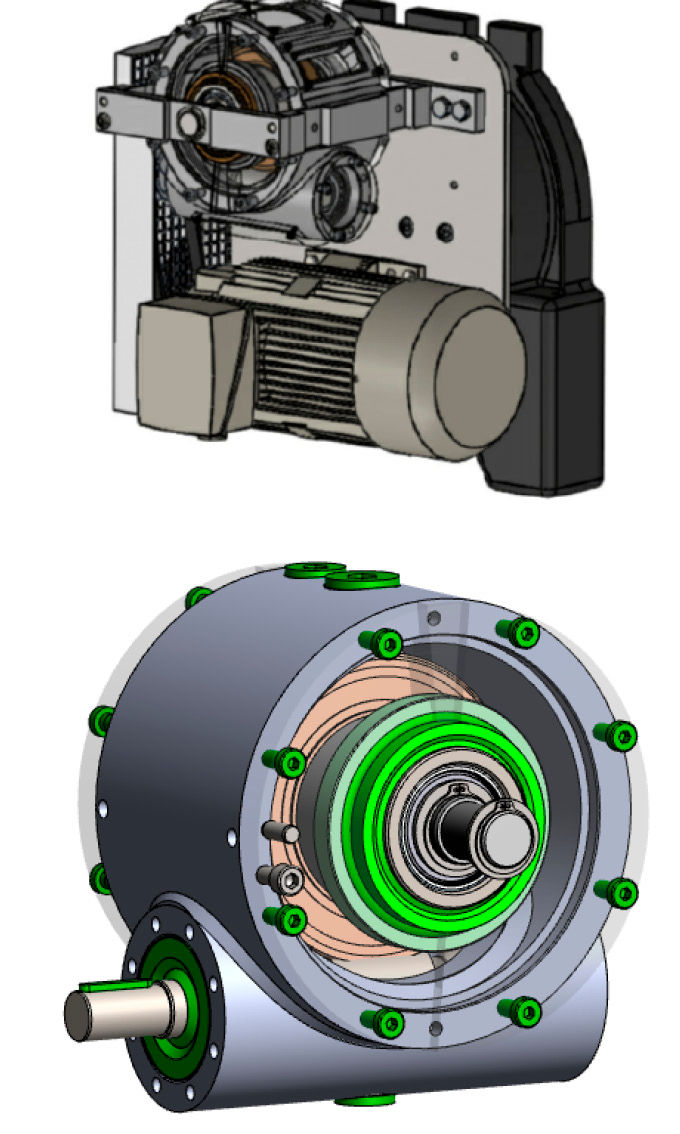
To determine the flow and the distribution of the grease, a gearbox with a transparent lid was used to get a look inside of it during operation. The test bench setup is described in Ref. 19 and shown in Figure 9. The gearbox is designed so that the worm and worm wheel are enclosed close to the contour by the tubular housing parts. The gearbox itself is mounted on a test rig and can be turned into various positions to examine different mounting positions of the worm.
Figure 9—Mounted test bench setup (top) and partly transparent worm gearbox (bottom) (Ref. 19).
During the experimental test, two greases with different consistencies were used, where one is classified as NLGI 1 and the other as NLGI 2 according to Ref. 4. To follow the movement of the grease inside the gearbox and track the intermixing, tracer particles were added to the greases, which can be stimulated to fluoresce by UV radiation. During the test, the drive speed, the location of the worm, the quantity of grease, and the location of application were varied to consider different conditions.
Results on Grease Distribution
The first test regarding the grease distribution was the experimental determination of the minimal quantity of grease to cover the worm and the worm wheel evenly with lubricant. The result was that the amount is independent of the location of application and grease consistency, because in all tests the approximate amount needed was 20 g. During these tests, it was also visible that the worm wheel functioned as a grease depot, whereas the worm distributed the grease by tearing it out of the tooth gaps. With an increasing amount of grease brought into the gearbox, dead spaces emerged in the gearbox where grease got deposited and was not conducted again by the worm or the worm wheel. An amount of grease sticks to the walls of the gearbox after its contribution and distributes itself poorly. This effect was more distinct with the use of the NLGI 2 grease, the grease with the lower consistency index distributed itself better after a short period of time and did not stick as much on the walls of the gearbox. The amount of grease spun out at a given speed was comparable between the two greases.
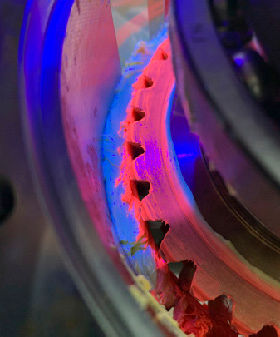
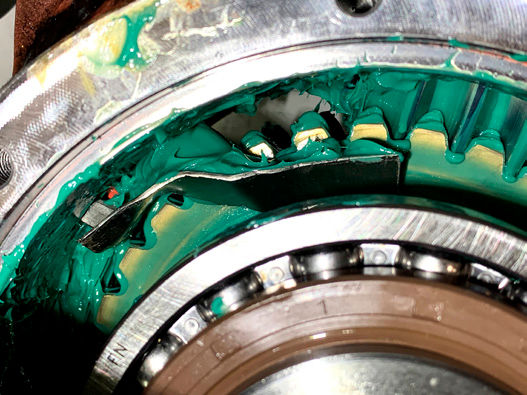
Monz already stated in Ref. 2 the effect of a so-called caterpillar as a relubrication mechanism inside the gearbox. This effect occurs when excess lubricant is carried on by the worm wheel and then drifts off at a narrow point. The developing depot grows when a critical amount of grease is exceeded, and a balance is formed between stripping at the beginning of the caterpillar and removal towards the end. The development of this effect is provoked by adding additional grease after the stationary state of lubrication, and in addition to that, the added grease is marked with tracer particles to inspect the intermixing inside the grease caterpillar. Figure 10 shows the emerged grease caterpillar after the test. The investigation on intermixing for the caterpillar is shown in Figure 11. The left picture in Figure 11 shows the behavior of the grease with a lower consistency class, and a good blend between the existing and added grease inside the gearbox is visible. In contrast to that, the grease classified as NLGI 2 in the right picture shows a worse blend of the different markers, resulting in two separate phases of grease. This means that used and fresh grease parts do not intermix as well, and the same grease is carried around in the gearbox all the time. In conclusion, the tested grease classified with the lower consistency had better characteristics regarding the intermixing and overall grease distribution inside the worm gearbox.
Figure 10—Grease caterpillar after the test.Figure 11—Intermixing of grease for NLGI 1 (left) and NLGI 2 (right).
The investigations on the intermixing of the grease showed that a significant amount of grease is not transported further into the contact and instead is deposited on the walls of the gearbox and the front side of the worm wheel. To reduce the amount of grease that deposits on the front side of the wheel and the walls of the gearbox, magnetic guide plates were added to the gearbox, which is shown in Figure 12.
Figure 12—Guide plate to influence the grease transport.
The circulating grease is wiped off at these plates and conveyed back towards the tooth contact to ensure sufficient lubrication. The addition of these guide plates led to a ring-shaped grease flow around the toothing of the worm gear, and a larger proportion of the quantity of introduced grease is mixed and thus actively used for lubrication. This works against the effect of bad intermixing, which was shown before.
Comparative Tests
To compare different locations of the worm, combined with the addition of the guide plates, tests were performed with constant values for the remaining parameters, such as speed and application of the grease. The results of these comparative tests are shown in Table 3.
Mounting position
Grease
Time for stable condition
Caterpillar
Dead Space
Worm below
170 g NLGI 1
6:00 min
Yes
Below worm
Worm below
150 g NLGI 2
7:00 min
Yes
Below worm wheel shaft
Worm above
100 g NLGI 1
4:30 min
Yes
None
Worm vertical
100 g NLGI 1
4:30 min
No
Shaft shoulder, guide plate
Table 3—Results of the comparative tests with guide plates.
The comparison between the different locations and greases shows a big difference regarding the grease distribution. With an eye on the location, the results indicate that the optimal mounting position of the worm gear is with the worm above, followed by a vertical arrangement. The tests with the worm below took the longest time to get into a stable state of grease distribution. In addition to that, the position with the worm above was the only configuration without a dead space in the whole gearbox, which is another benefit over the other mounting positions. Furthermore, the necessary amount of grease to reach the defined condition of lubrication is significantly less when the worm is located above the worm wheel.
Conclusion
The question “How to replace oil as a lubricant in worm gearboxes with grease” was addressed using two different approaches in this work. The first part included the idea of an analytical method to describe the friction in the tooth contact of a grease-lubricated worm gear. Because of the mixed friction conditions, the combination of boundary friction and fluid friction must be considered in the calculation. The boundary friction was therefore determined using a two-disc test bench with comparable operating conditions to the tooth contact. Furthermore, the calculation of the film thickness was shown, which is a key value to determine the ratio between boundary and fluid friction. In that case, two different approaches for the calculation were presented and compared to experimental results of film thickness measurements on a ball-on-disc tribometer. The results of these investigations showed that for this grease, there is an approach that matches the experimental results better than the other.
In addition to the analytical approach, experiments on the grease distribution inside the gearbox were presented. During these tests, two major experience values emerged from the experiment: the optimal mounting position and the constructional adaptations to the gearbox. In regard to these results, the gearbox for the experimental validation of the analytical model will be designed with a worm position above, and further investigations regarding the use of guide plates will be performed.
To provide an outlook into further investigations regarding grease lubrication in worm gears, the analytical calculation will be expanded further so that the actual fluid friction can also be calculated using grease. With this final addition, the efficiency of the worm gearbox can be determined and will then be verified with an efficiency test on an actual test bench.
In conclusion, there is an easy way to replace oil as a lubricant in worm gearboxes with grease by simply changing the lubricant without changes to the design of the gearbox. This simplistic approach seems easy at first thought, but comes at the cost of an unoptimized gearbox. By using an analytical calculation method combined with experimental tests to find an optimized gearbox design for grease lubrication, the efficiency of these gearboxes can be increased in the future.
Acknowledgement
This work was supported by the German Federal Ministry of Economic Affairs and Climate Action (IGF 22365 N) within the framework of the Forschungsvereinigung Antriebstechnik e.V. (FVA project 962 I).
Appendix
The following equations show the calculation of the central film thickness for the elliptical point contact, shown in Equation 6, and the necessary parameters according to Venner (Ref. 17). The equation for the central film thickness for the elliptical point contact is again shown in Equation 8.
(8)
The dimensionless parameter for the central film thickness Hcen is described by equation (9).
(9)
The further parameters in equation (8) are the dimensionless load parameter M
(10)
and the dimensionless material parameter L
(11)
and the auxiliary variables r, s and t calculated from M and L
(12)
(13)
(14)
The two dimensionless parameters M and L in turn consist of the dimensionless material parameter G
(15)
the dimensionless velocity parameter U
(16)
and the dimensionless load W
(17)
References
Crosher, W. P., 2002, Design and Application of the Worm Gear, American Society of Mechanical Engineers, New York.
Monz, A. T., 2012, “Tragfähigkeit und Wirkungsgrad von Schneckengetrieben bei Schmierung mit konsistenten Getriebefetten,” Ph.D. thesis, Technical University of Munich.
Lugt, P. M., 2013, Grease Lubrication in Rolling Bearings, John Wiley & Sons Incorporated, New York.
DIN51818:1981, Schmierstoffe; Konsistenz-Einteilung für Schmierfette; NLGI-Klassen.
DIN281:2010, Wälzlager–Dynamische Tragzahlen und nominelle Lebensdauer.
Hamrock, B. J. and Dowson, D., 1978, “Elastohydrodynamic Lubrication of Elliptical Contacts for Materials of Low Elastic Modulus I—Fully Flooded Conjunction,” Journal of Lubrication Technology, Vol. 100, No. 2: pp. 236–245, DOI 10.1115/1.3453152.
Morales-Espejel, G. E., Lugt, P. M., Pasaribu, H. R., and Cen, H., 2014, “Film thickness in grease lubricated slow rotating rolling bearings,” Tribology International, Vol. 74: pp. 7–19, DOI 10.1016/j.triboint.2014.01.023.
Cousseau, T., Björling, M., Graça, B., Campos, A., Seabra, J., and Larsson, R., 2012, “Film thickness in a ball-on-disc contact lubricated with greases, bleed oils and base oils,” Tribology International, Vol. 53: pp. 53–60, DOI 10.1016/j.triboint.2012.04.018.
Oehler, M., 2018, “Methodische Ansätze zur Optimierung des Wirkungsgrades von Schneckengetrieben,” Ph.D. thesis, Technical University Kaiserslautern, Kaiserslautern.
Müller, F., Oehler, M., and Koch, O., 2023, “Tribometerversuche zur Reibungsmessung im fettgeschmierten Stahl-Bronze-Kontakt.” 64th Tribology Conference: Friction, lubrication and wear. Göttingen: pp. 242–251.
DIN2137:2016, Mineralölerzeugnisse und Schmierstoffe–Bestimmung der Konuspenetration von Schmierfetten und Petrolatum.
DIN51817:2014, Prüfung von Schmierstoffen - Bestimmung der Ölabscheidung aus Schmierfetten unter statischen Bedingungen.
Wingertszahn, P., Schmitt, S., Thielen, S., Oehler, M., Magyar, B., Koch, O., Hasse, H., and Stephan, S., 2023, “Measurement, Modelling, and Application of Lubricant Properties at Extreme Pressures”, Tribologie und Schmierungstechnik, Vol. 70, 4-5: pp. 5–12, DOI 10.24053/TuS-2023-0017.
Walbeck, T., 2004, “Schmierfilmdicke–Einfluss von Grundölart, Additivierung und Gebrauchszustand auf Viskositätsverhalten und Schmierfilmbildung. Abschlussbericht zum FVA-Forschungsvorhaben 400 (Heft 743),” Institut für Maschinenelemente und Maschinengestaltung der RWTH-Aachen (IME), Frankfurt/Main.
Gold, P. W., Schmidt, A., Loos, J., and Aßmann, C., 2001, “Viskosität-Temperatur-Koeffizienten von mineralischen und synthetischen Schmierölen,” Tribologie und Schmierungstechnik, Vol. 48, No. 1: pp. 40–48.
PCS Instruments, 2022, “EHD-HS Brochure”, from https://pcs-instruments.com/wp-content/uploads/2022/11/EHD-HS-Brochure.pdf.
Venner, C. H. and Napel, W. E. ten, 1992, “Multilevel solution of the elastohydrodynamically lubricated circular contact problem Part 2: Smooth surface results,” Wear—An International Journal on the Science and Technology of Friction, Lubrication and Wear, Vol. 152, No. 2: pp. 369–381, DOI 10.1016/0043-1648(92)90133-s.
Dowson, D. and Higginson, G. R., 1961, “New Roller-Bearing Lubrication Formula,” Engineering, Vol. 192, No. 4972: pp. 158–159.
Norgauer, P., Grunewald, L., Priester, L., Heilemann, J., Hein, M., and Stahl, K., 2020, “Experimentelle Ermittlung der Ölströmung in tauchgeschmierten Schneckengetrieben,” Forschung im Ingenieurwesen, Vol. 84, No. 2: pp. 141–150, DOI 10.1007/s10010-020-00393-3.
First presented at the 2024 Fall Technical Meeting (FTM), October 7–9, 2024, Rosemont, IL, and printed with permission of the author(s). Statements presented in this paper are those of the author(s) and may not represent the position or opinion of the American Gear Manufacturers Association.
[advertisement]
×
Like What You see?
Power Transmission Engineering is THE magazine of mechanical components. PTE is written for engineers and maintenance pros who specify, purchase and use gears, gear drives, bearings, motors, couplings, clutches, lubrication, seals and all other types of mechanical power transmission and motion control components.
*Unsubscribe any time. Full details in our privacy policy


 Power Transmission Engineering is THE magazine of mechanical components. PTE is written for engineers and maintenance pros who specify, purchase and use gears, gear drives, bearings, motors, couplings, clutches, lubrication, seals and all other types of mechanical power transmission and motion control components.