Tuning Flank Waviness for Minimized Mesh Force Variation
Objectives
Conventions
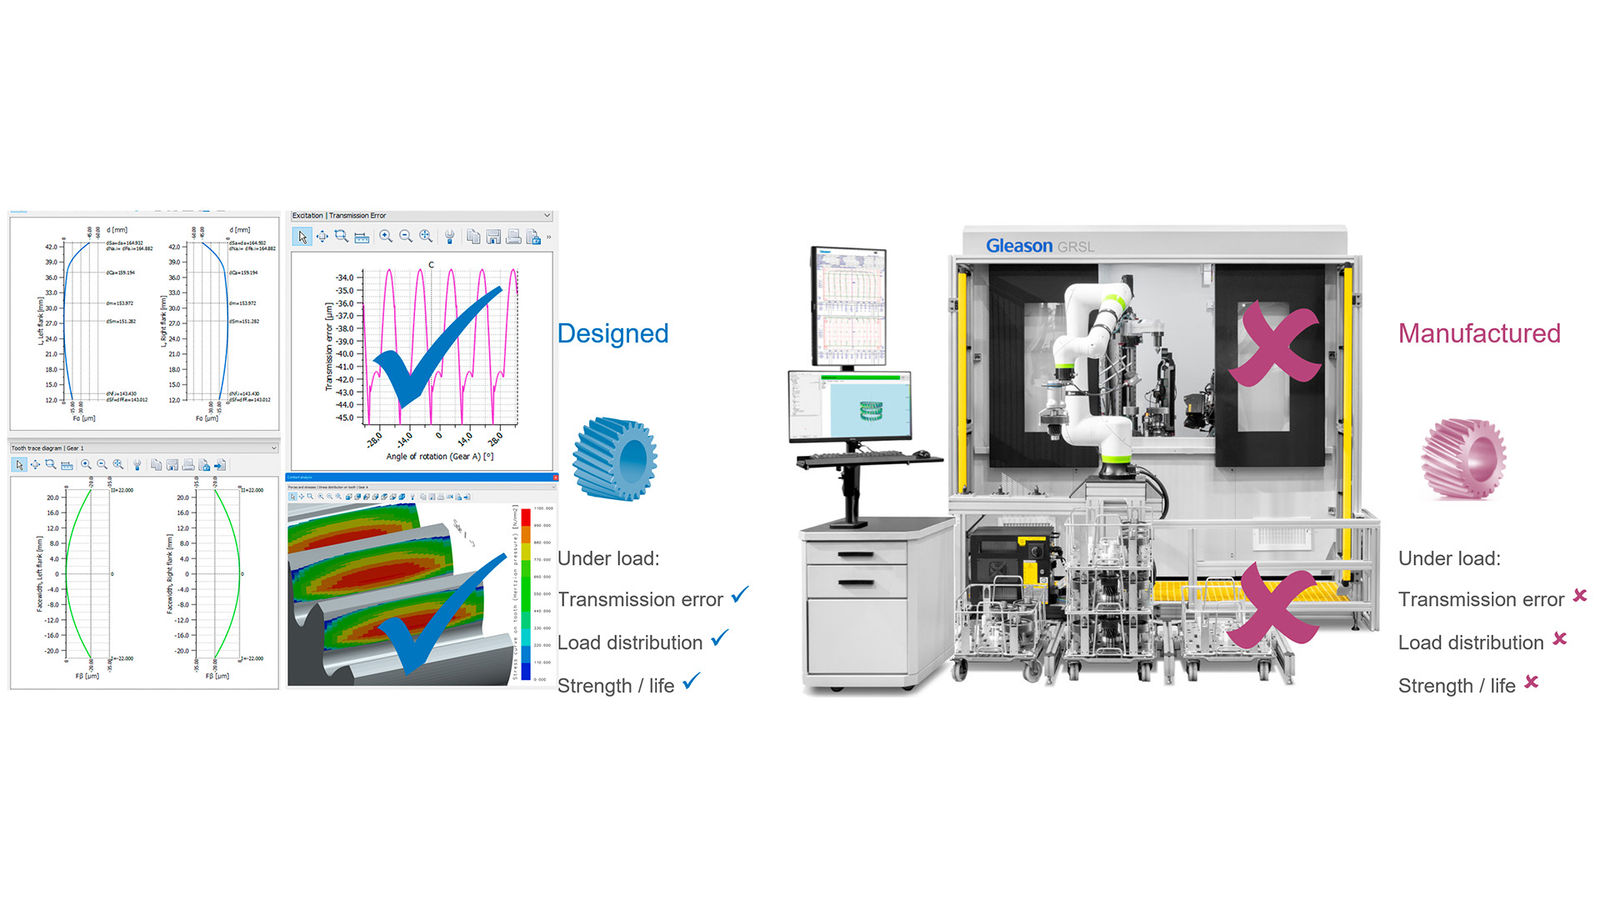
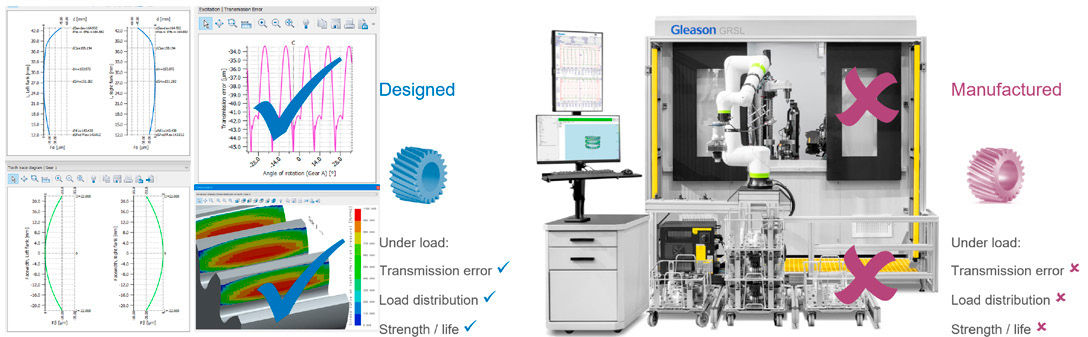
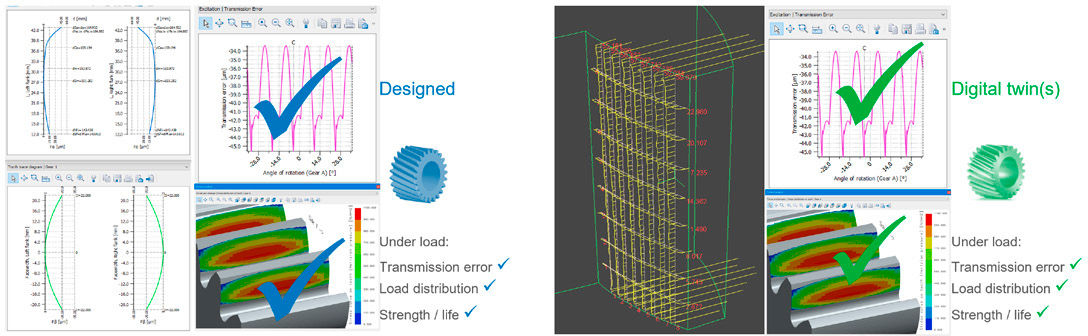
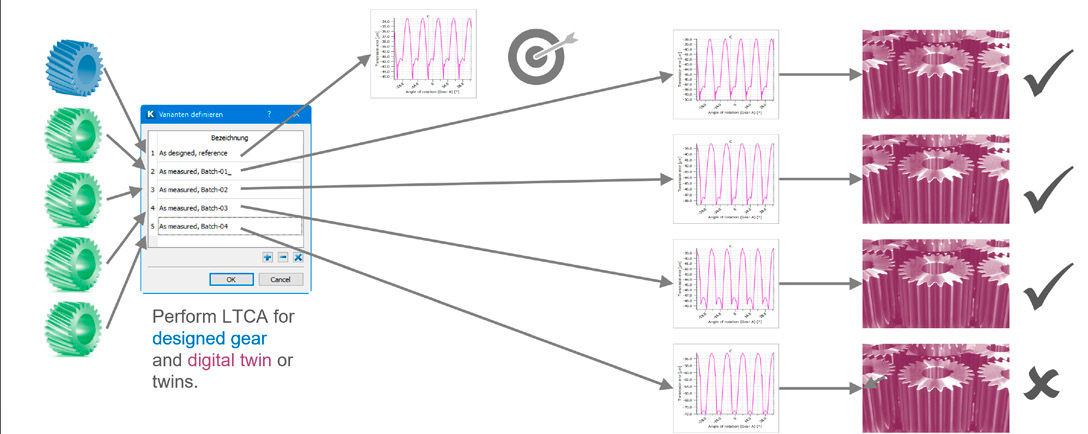
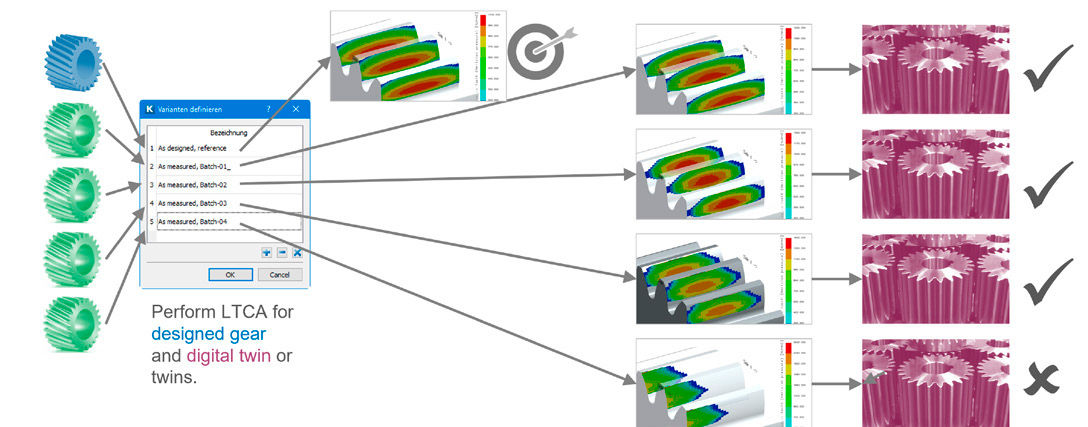
In the figures below, blue indicates the designed gear, red the manufactured or measured gear and green the digital twin.
Introduction to the Problem
Loaded tooth contact analysis of gears, considering or neglecting gear misalignment, may be performed by gear design software such as KISSsoft or other similar tools. Approximately a dozen such commercial software programs are used in an international environment, most of them based on analytical approaches. Very few are based on FEM approaches. With this, the performance characteristics of a gear design are assessed, considering:
Transmission error TE and its spectral content.
Peak to peak transmission error PPTE.
Contact stress, its maximum value and distribution.
Gear mesh force variation over a meshing cycle.
Micropitting and scuffing safety, flank and root strength, considering the calculated load distribution.
Others.
Figure 1—Left, designed gear: Assessment of performance parameters such as transmission error, load distribution or strength is possible considering micro geometry, using LTCA. Right, manufactured gear: Assessment of the same performance parameters is practically impossible in a manufacturing environment.Figure 2—Left, designed gear: Assessment of performance parameters such as transmission error, load distribution or strength is possible considering micro geometry, using LTCA. Right, digital twin gear: Assessment of the same performance parameters is again possible through LTCA.
In principle, it is possible to measure the above performance characteristics also on manufactured gears. Costs in time, equipment and money typically do not allow for this approach in a manufacturing environment. This means that deviations in the geometry of the manufactured gear compared to the designed gear are assessed only in the sense of whether the manufactured gear meets the quality grade stipulated on the manufacturing drawing, e.g., along ISO 1328. But a question “… we manufactured a batch of gears, we measured a form error of xyz μm, is the resulting degradation of gear strength acceptable or do we need to scrap the batch?” cannot be answered.
Closed Loop as Solution
If, however, the manufactured and measured gear geometry could be looped back into the original KISSsoft gear design and combined with the designed gear to create a digital twin of the manufactured gear(s), then this twin—or these twins—could be subjected to the same calculations. And the resulting performance characteristics, e.g., contact pressure, may be compared to those of the designed gear. Strength rating methods, e.g., ISO 6336, would then allow for the calculation of gear strength of the manufactured gear and a degradation may be assessed by a gear designer familiar with the requirements. A decision, whether a batch of gears having a geometric deviation needs to be scrapped, is then based on relevant performance characteristics (strength, lifetime, reliability, scuffing safety, etc.), not only on a gear quality number.
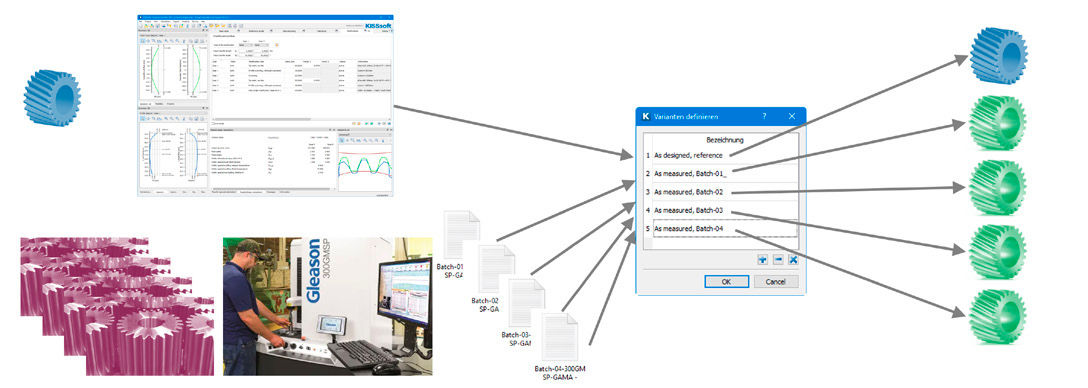
Figure 3—Both the designed gear geometry and several manufactured gears’ geometries may be managed simultaneously in software as digital twins, allowing for the calculation of performance parameters and comparison to those of the designed gear.Figure 4—Transmission error TE as a performance parameter. The TE of the designed gear is compared to the TE of the digital twins. If for a digital twin, the TE is found deviating too much from the reference, the manufactured gear (or batch of gears) is scrapped.
The calculation of the above-mentioned performance parameters of the designed gear as the reference and of several gears or batches of gears as manufactured and measured is done in KISSsoft through variants of the geometry. This means that simultaneously, several gears are defined in one calculation. All have the same gear macro and micro geometry, but each has a different amount of deviation from the reference gear (of course, the reference gear has zero deviation from itself and is variant No. 1), as measured. This means that in a single calculation file, the reference and as many digital twins as required are managed.
The reference design and the digital twins are then subjected to an LTCA. Transmission error, contact stress levels or contact pattern shape and position of the digital twins are then compared to the results of the designed gear. If deviations in the performance parameters are within acceptable limits, the gear or batch of gears is approved. If deviations are too high, the gear or batch of gears is rejected. With this approach, quality control is far more target-oriented compared to using only a gear quality number. It also requires more experience to assess the performance characteristics.
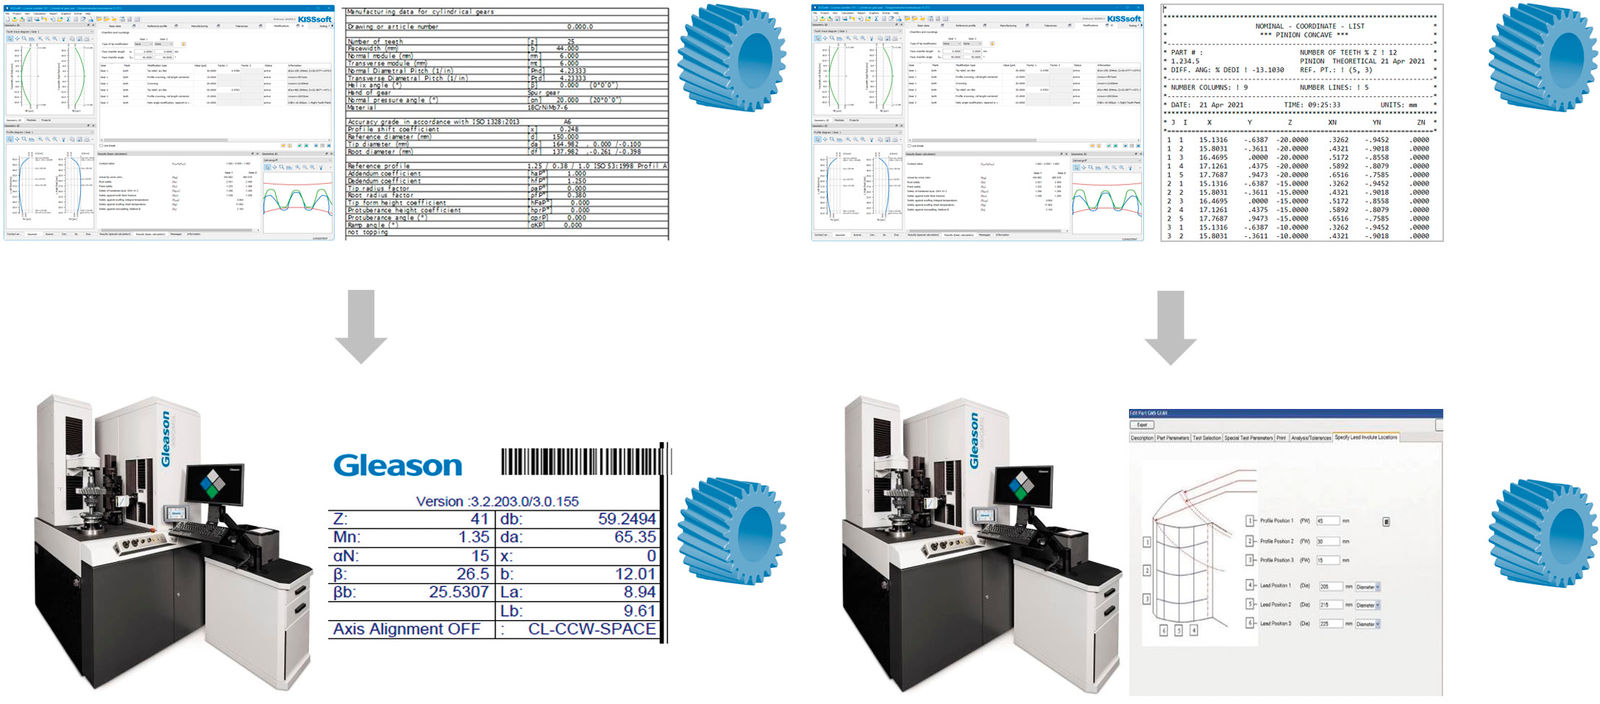
Figure 5—Contact pressure or contact pattern as a performance parameter. The contact stress level and shape of the contact pattern of the designed gear are compared to one of the digital twins. If for a digital twin, the contact pattern is found to be unacceptable when compared to the designed gear, the manufactured gear (or batch of gears) is scrapped.Figure 6—Top: Only gear macrogeometry is transferred from gear design software KISSsoft to GAMA gear measurement software. Bottom: Both gear macro- and microgeometries are transferred.
Creating the Digital Twin
Measuring a Grid of Points on the Flank as State of the Art
To create a digital twin, it is state of the art to measure a grid of points on the flank, compare their measured coordinates to the coordinates calculated based on the gear macro and micro geometry, and feed the deviations back to the designed gear to convert it to a digital twin. This approach has been available for some time. The gear macro geometry, as designed in the gear design software, is exported as a Gleason GAMA software-compatible file or through GDE format, along with VDI/VDE 2610 guideline. Furthermore, direct export and import of a grid of points (rather than their coordinates and normal vector) from KISSsoft to GAMA is available.
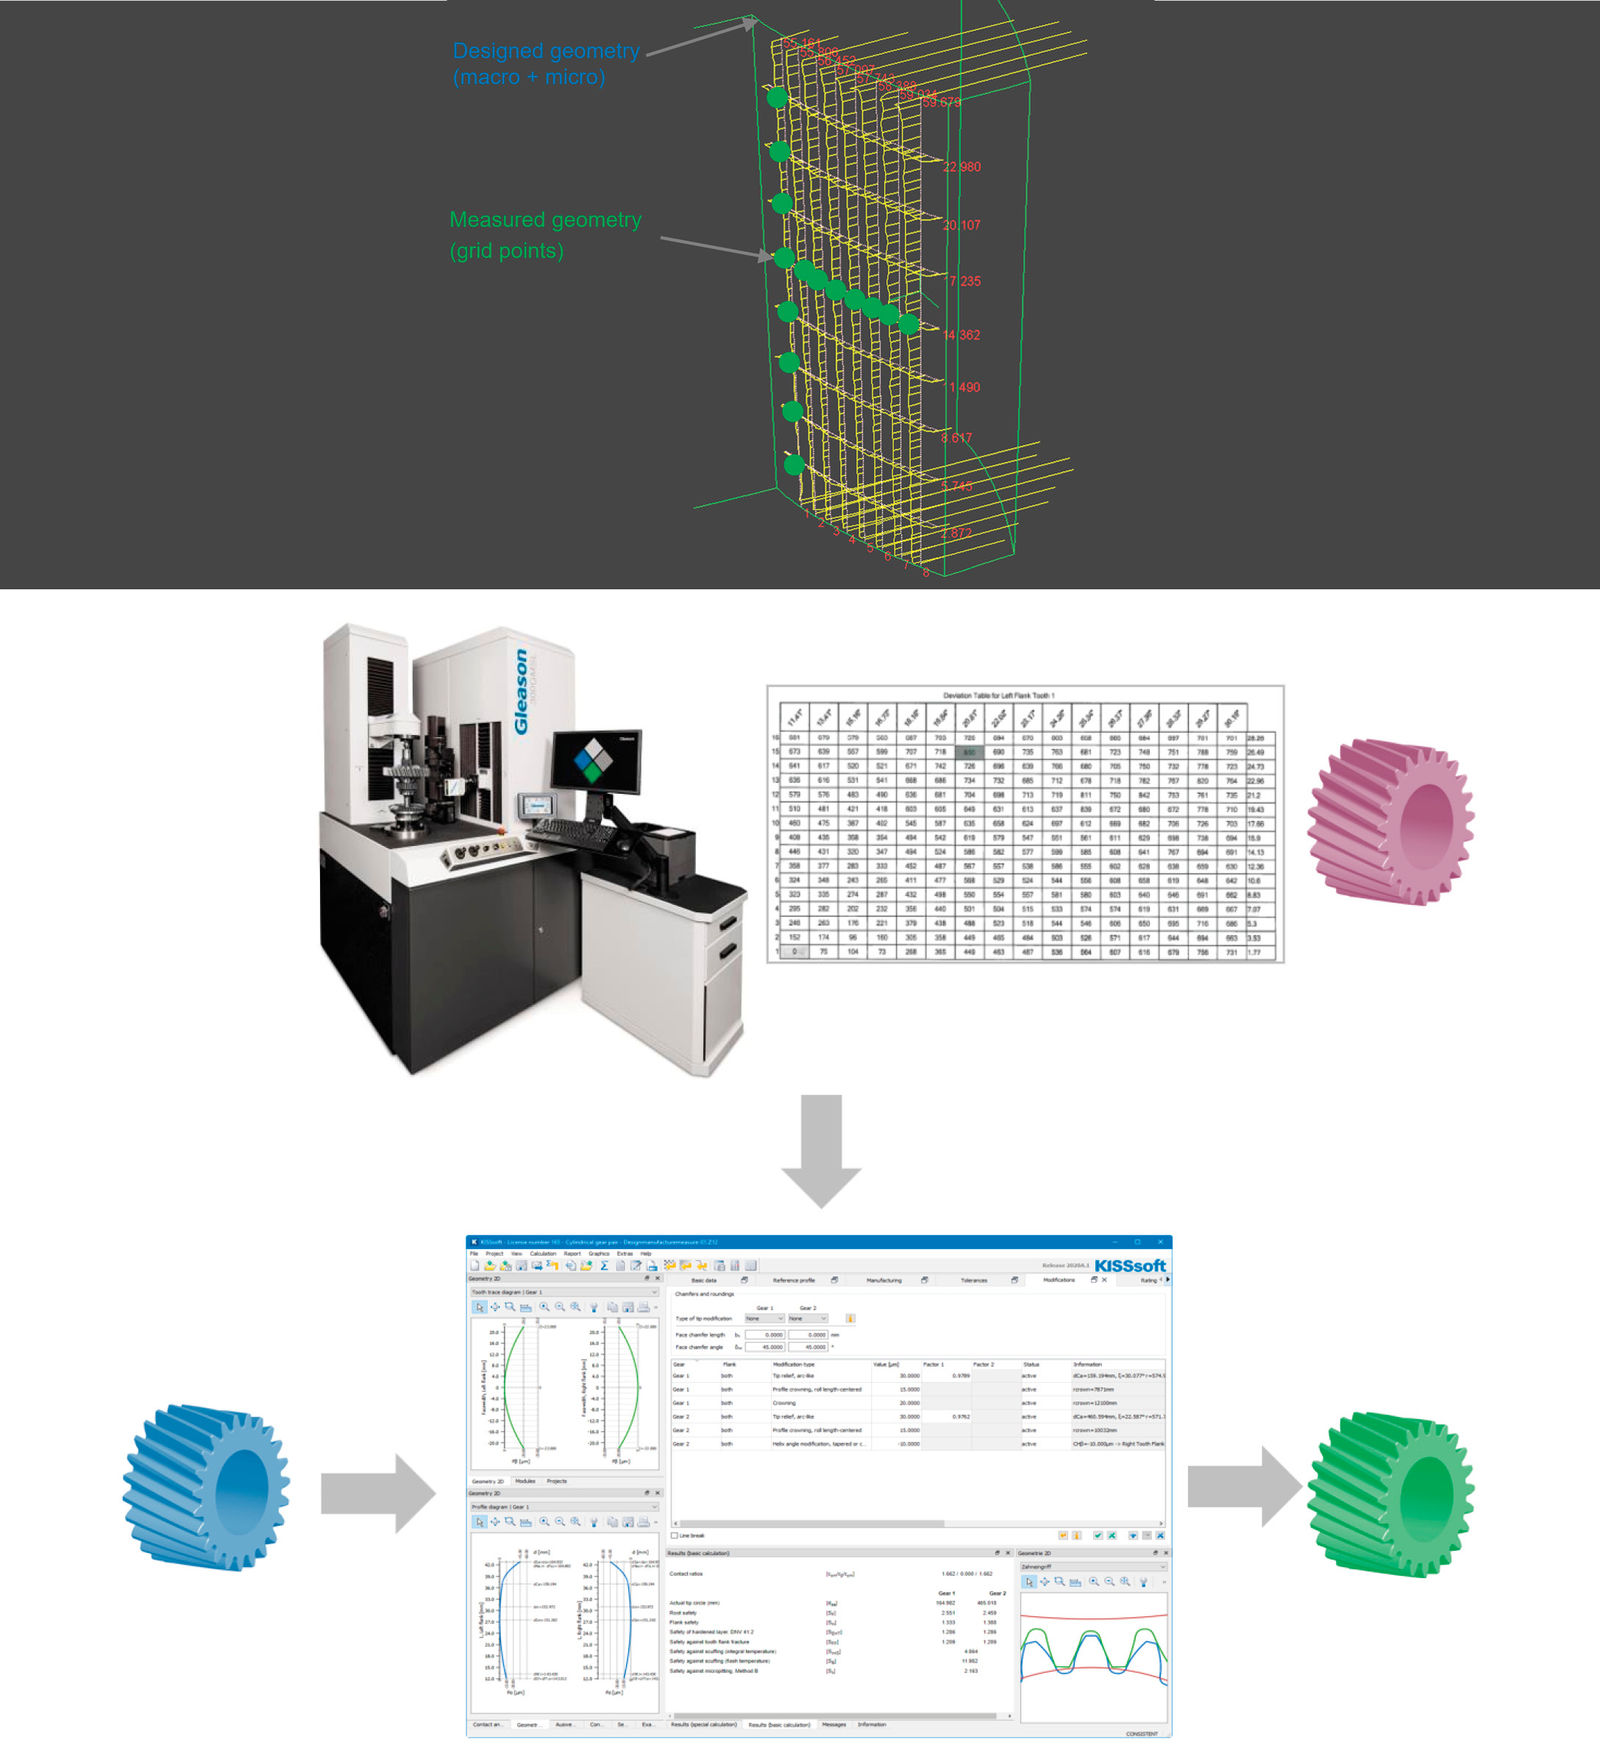
With this approach, the gear measurement machine knows the grid, the grid point designed coordinates and the grid point normal vectors. The measurement of the as-is coordinates of these points is then performed using a tactile probe. In Figure 7, the grid indicated consists of 8 × 8 points (green dots). The output is then an 8 × 8 table showing the deviation of the measured grid point coordinates from the designed grid point coordinates or rather the deviation as a scalar, to be understood in the direction of the normal vector of the corresponding point. This table is then imported into the design software, where the designed gear is modified by the imported deviation table to generate the digital twin.
Such a digital twin is suitable for the assessment of tooth contact patterns and load distribution on the flank and will already be most helpful to assess manufacturing deviations like errors in pressure angle, helix angle, crowning or twist.
Figure 7—Top: Gear flank is measured on a point grid. Bottom: Deviation from the designed geometry is tabulated in GAMA and transferred to KISSsoft. There, designed geometry is combined with the deviation to create the digital twin.
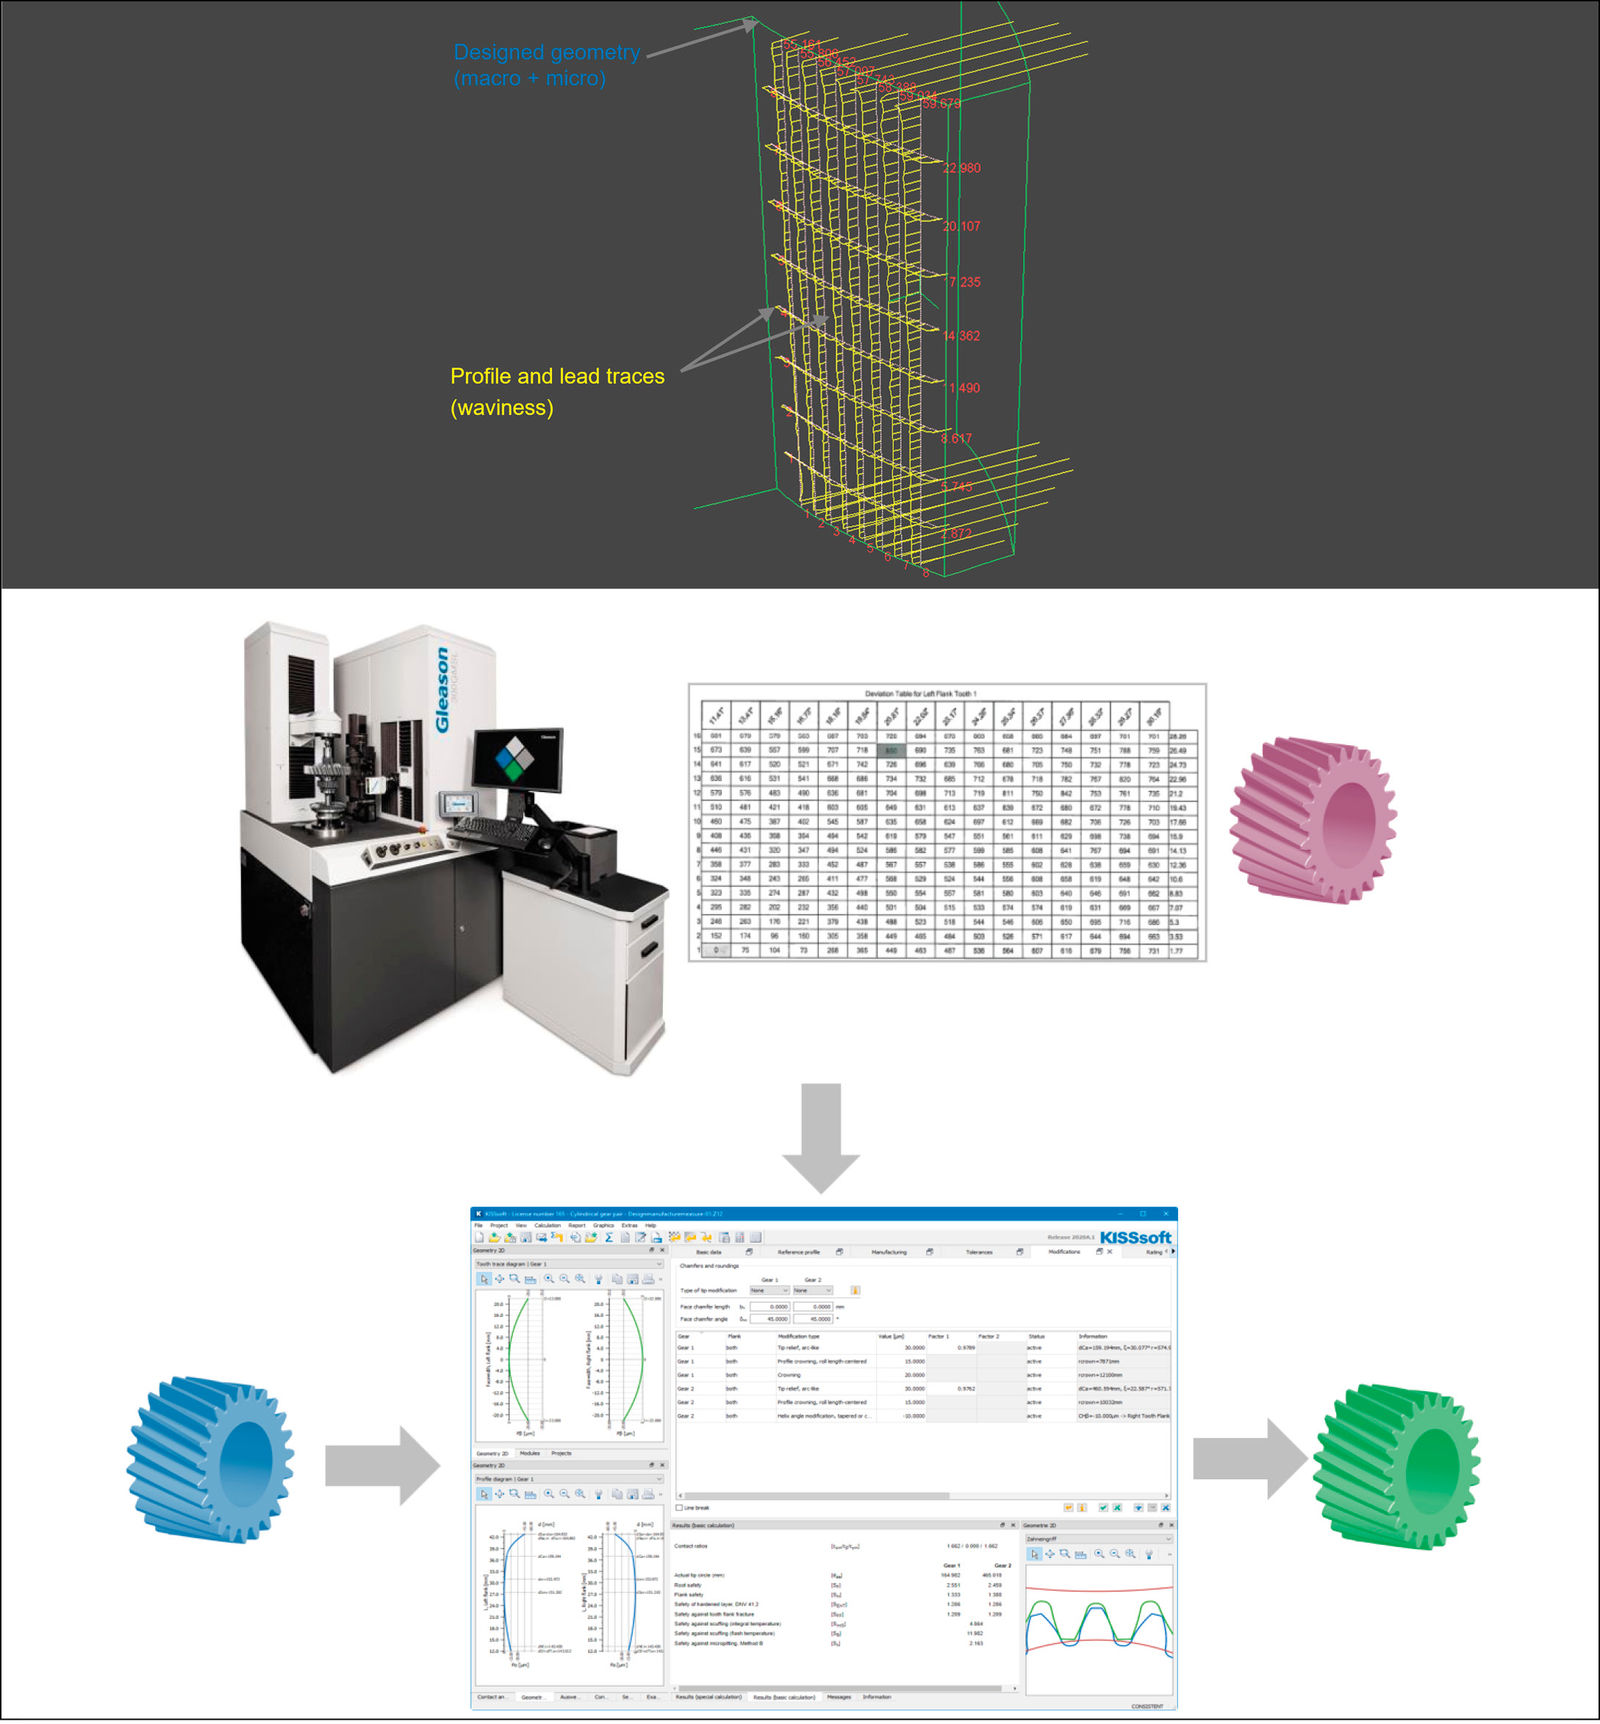
Measuring Flank Waviness as Next Step
In the above process, only 8 × 8 = 64 points are measured and the shape of the flank between the measured points is not known. A more refined approach is to not only transfer individual points of information from the measurement but whole traces in lead and profile directions (which is just a much higher number of points). Traces are measured and displayed in Gleason GAMA software, see the yellow lines on the left side of Figure 8. These traces show a waviness; they may also be visible in printouts, as shown in the top right of Figure 8. These traces are now to be represented in the gear design software so that the gear model there also includes the waviness as it is present in the manufactured gear. At the time of writing this paper, this was not yet automatically possible but required a manual approximation of the shape of the trace in the gear design software, using functions to approximate it there. Note the comment in the section on “Future Work” where this point is addressed as a subject for improvement of the software interface.
With this approach, the digital twin contains far more information on the manufactured gear since a much higher number of data points is considered. At the time of writing this paper, however, it is only possible to import one trace in lead and one trace in profile direction (or one trace with an inclination as explained in the following section). This is again a shortcoming of the current software version to be addressed in the future. The underlying assumption is that waviness is a systematic result of the manufacturing process, manufacturing machine and tool properties. Hence, it is reasonable to assume, in a first approximation, that the waviness in profile direction is constant along the face width or the waviness in lead direction is constant in profile direction. In the next section, definitions and descriptions of how the waviness is defined in the gear design software are given.
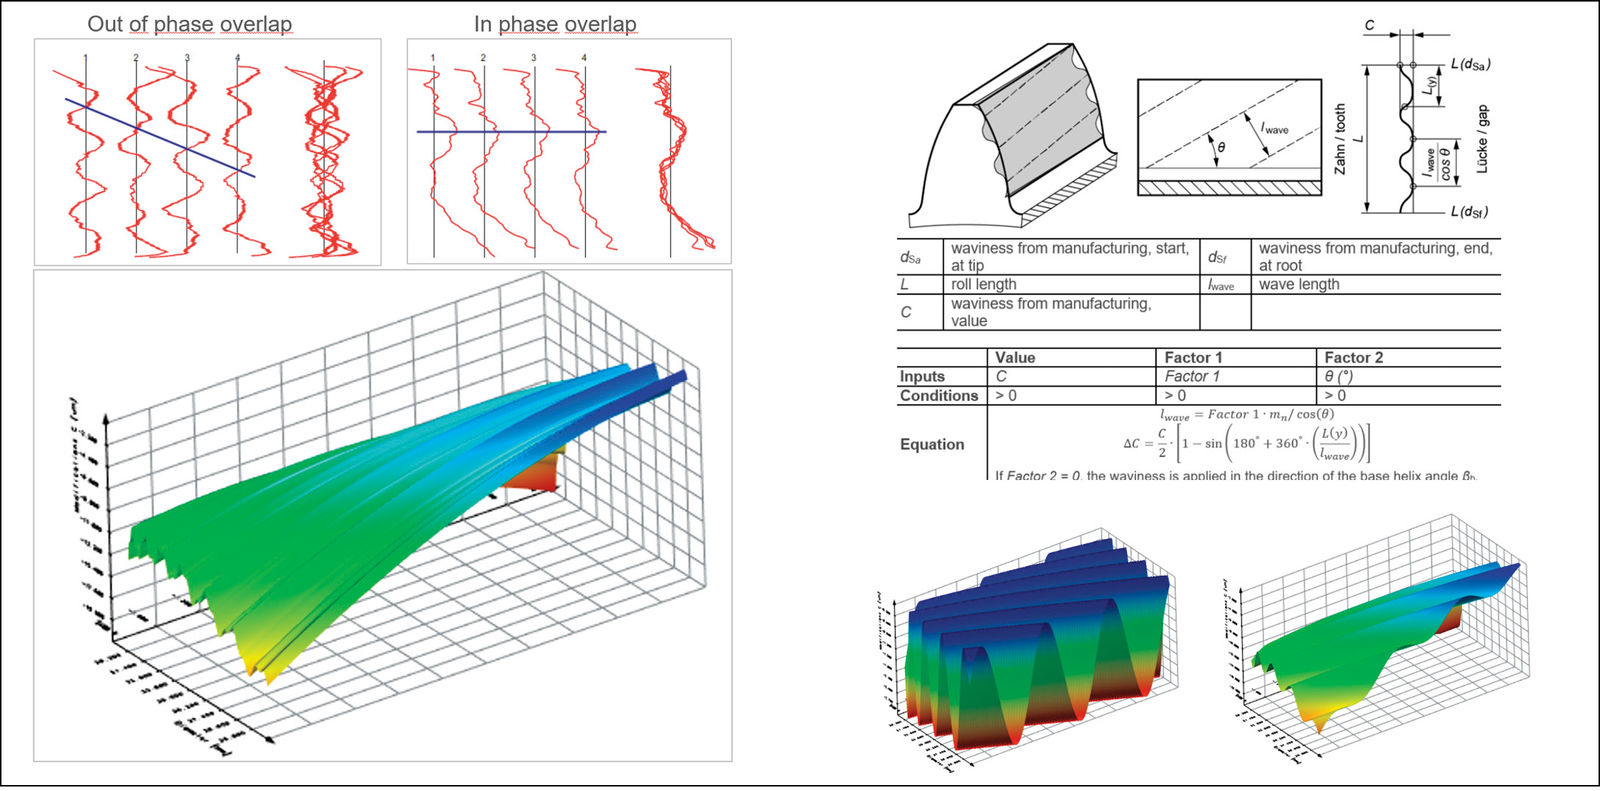
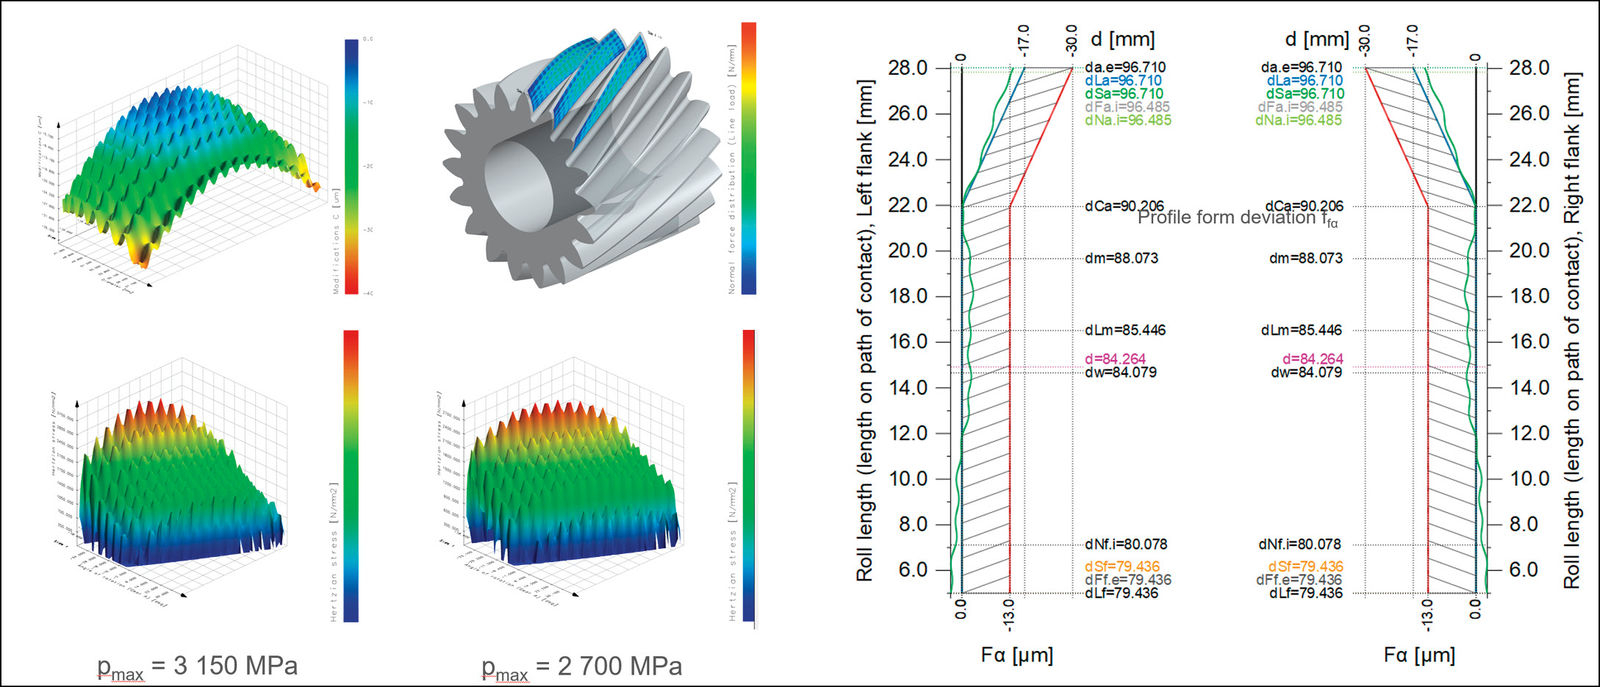
Figure 8—Left: Gear flank is measured along traces in profile and lead direction. Right: Traces, containing the information on the deviation from the designed geometry are transferred to KISSsoft. There, designed geometry is combined with the deviation along profile and lead traces to create the digital twin.Figure 9—Top: Waviness along profile, as an overlap of several sinus forms. Bottom: Definition of one sinus form, inclined to the profile direction by an angle. Definitions as used in KISSsoft Gear Design Software.Figure 10—Left: Waviness in lead and profile direction, flank geometry and contact stresses. Right: K-chart or profile diagram showing the tolerance for a gear with tip relief and approximated flank geometry including waviness.
Definitions and Description of Waviness
On the left side of Figure 9, the waviness is shown as a three-dimensional image. The vertical axis shows the deviation of the manufactured and measured geometry from the designed geometry. Note the waviness in one direction. Note that the plane is twisted due to the natural twist from manufacturing. Note that this waviness is concerning one flank. In a mesh, several flanks are in contact at one point in time, and the waviness in one contact and the waviness in the next contact (for contact ratio above unity) overlap. On the right side of Figure 9, the definition of waviness on the flank, inclined by an angle, is shown. The amplitude, wavelength, inclination angle and phase shift are needed to define the waviness where the shape is a sinusoidal form. If the angle is set to zero, a waviness in profile direction results; if set to 180 degrees, a waviness in lead direction results.
Several such waviness definitions may be superimposed. On the left of Figure 10, waviness patterns in lead and profile direction are superimposed, creating a “rough” gear flank. Depending on the amplitude of this “roughness”, different maximum peak stresses result. Such an approach may be helpful to explain the formation of micropitting in a pattern resembling grinding marks. In the right of Figure 10, several waviness definitions having different phase shift, amplitude and wavelength are superimposed in the profile direction. This results in a composite waviness in profile direction that is not intuitively recognized as a superposition of sinusoidal shapes but looks realistic.
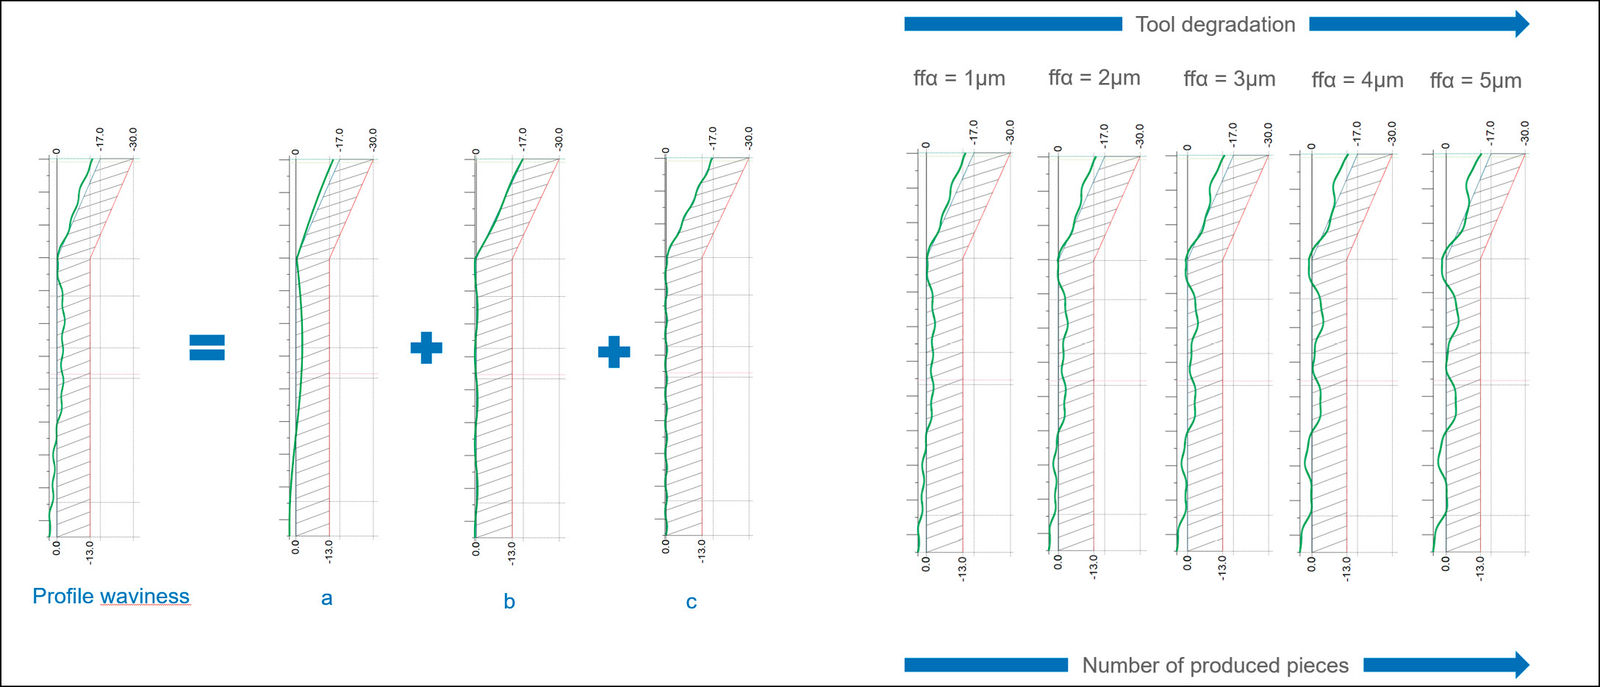
To represent the measured waviness, e.g., in profile direction, the user must come up with several sinusoidal curves and superimpose them. By adjusting phase shift, amplitude and wavelength for each sinusoidal curve, different patterns for the resulting waviness are achieved. With this approach, by increasing the amplitude, wear of a tool and an increase in waviness in production between dressing of the tool may be considered. Currently, the software lacks the functionality to create the individual sinusoidal shapes, again, a function to be added.
Application
Gear Mesh Example
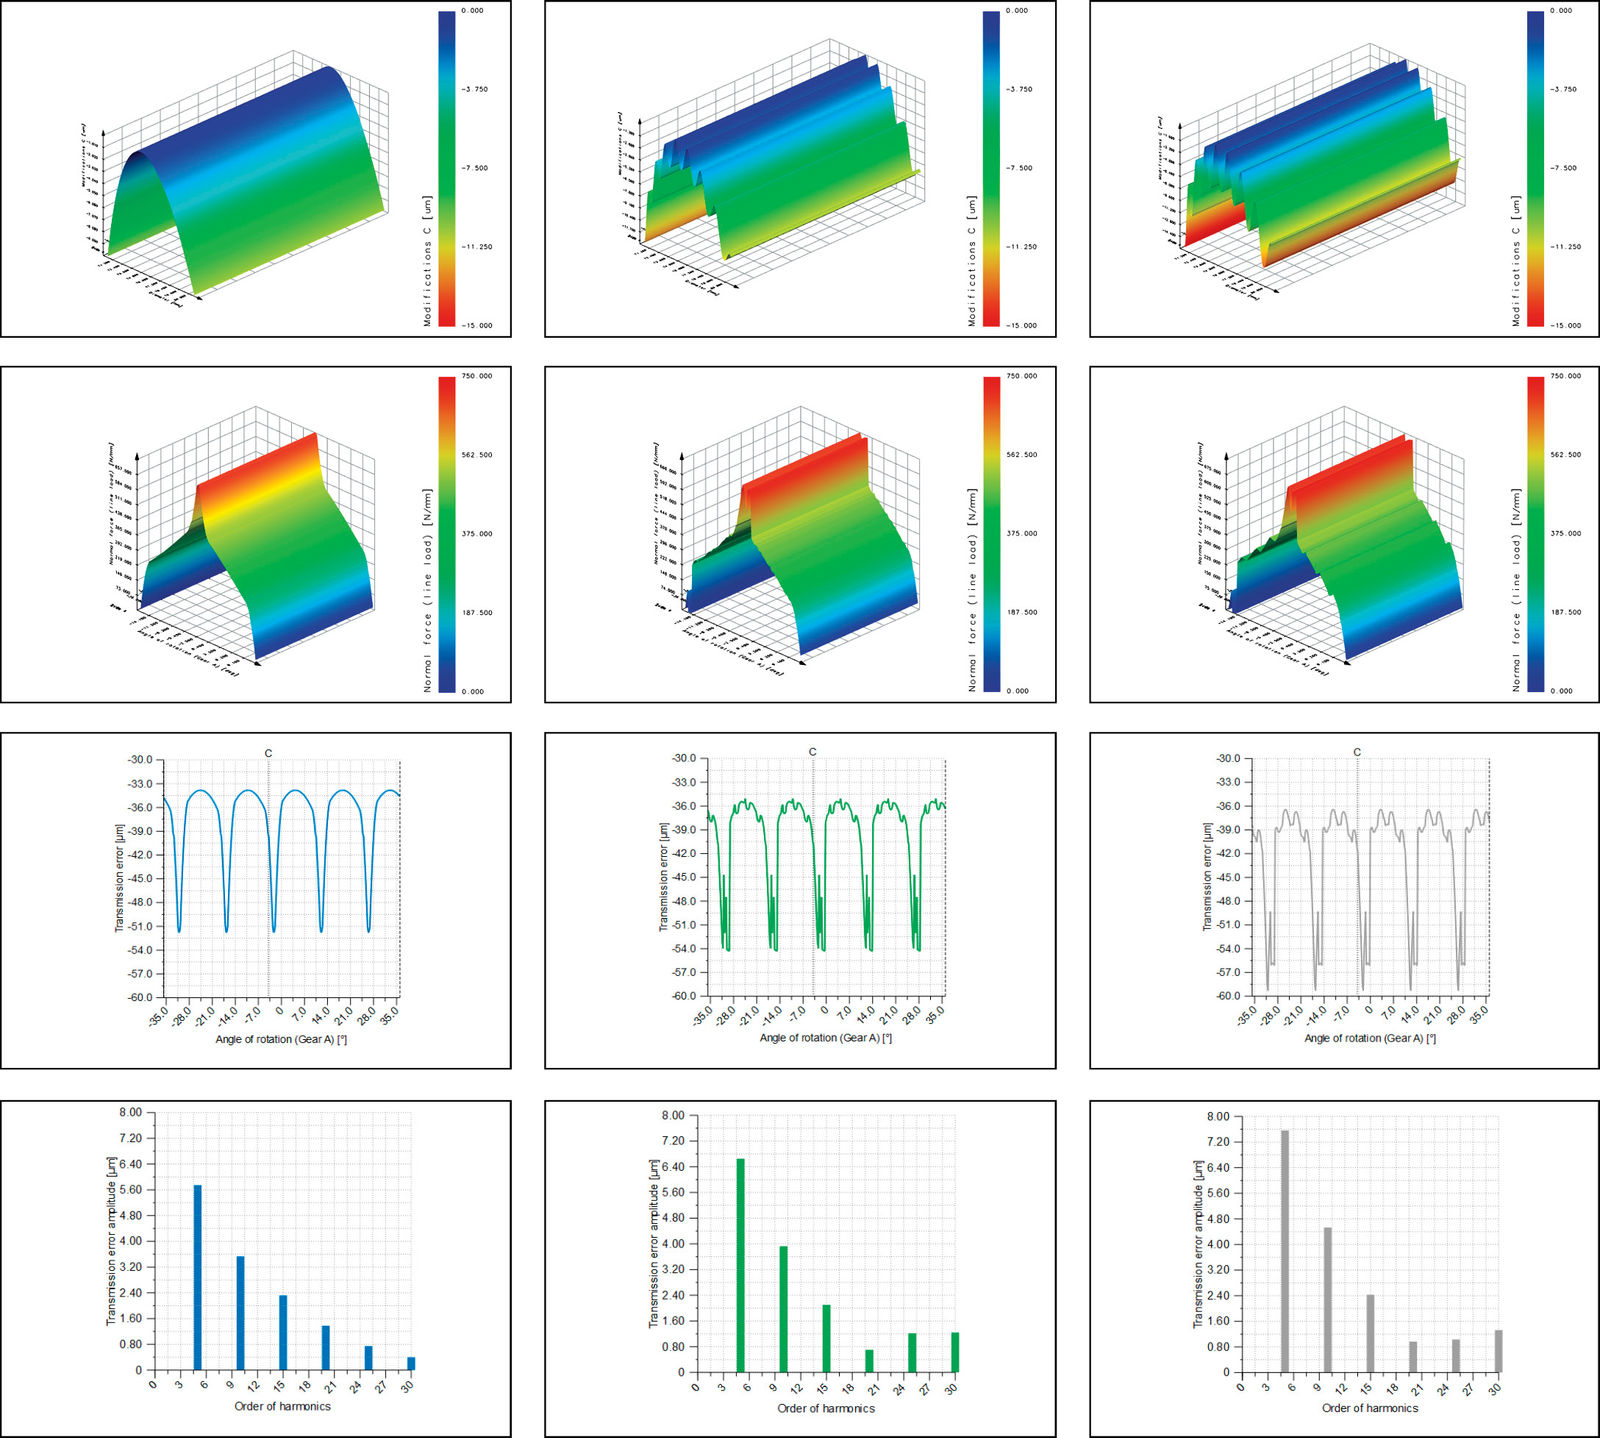
To illustrate the effect of waviness on calculated performance characteristics like transmission error and load distribution, we use a pinion gear mesh. Both gears are spur gears. As a reference calculation, only profile crowning is applied to the pinion. For a second calculation considering gear waviness, a waviness is applied on the pinion, having a reference amplitude. For a third calculation, the waviness amplitude is doubled. An LTCA for the three meshes is performed and the results are shown in Figure 12.
We observe that the line load changes very little, far less than what would be needed to indicate the need for a change in design. It is interesting to note that the PPTE value does not change proportionally to the waviness amount. The most interesting result is that for the gears having waviness, the higher-order amplitudes in the spectrum of the transmission error increase. Here, we see the influence of the waviness on the transmission error.
Figure 11—Left: Approximation of the measured waviness by superimposition of a few sinus-shaped forms with different amplitude, phase and wavelength. Right: Same form of waviness but increasing amplitude to study the effect of e.g., tool wear.
[advertisement]
The above is not a systematic approach to the phenomenon of waviness and its influence on the performance of a gear mesh. Far more extensive parameter studies are required. However, it does illustrate that
There is an influence of the waviness on performance characteristics.
They are accessible through LTCA.
Results are plausible and encouraging.
The influence of waviness is negative (stresses and PPTE increase).
The increase in PPTE indicates that the excitation of a gearbox housing by the gear mesh will be more in case waviness is present. This aspect is investigated in detail in the next section.
Gearbox Example
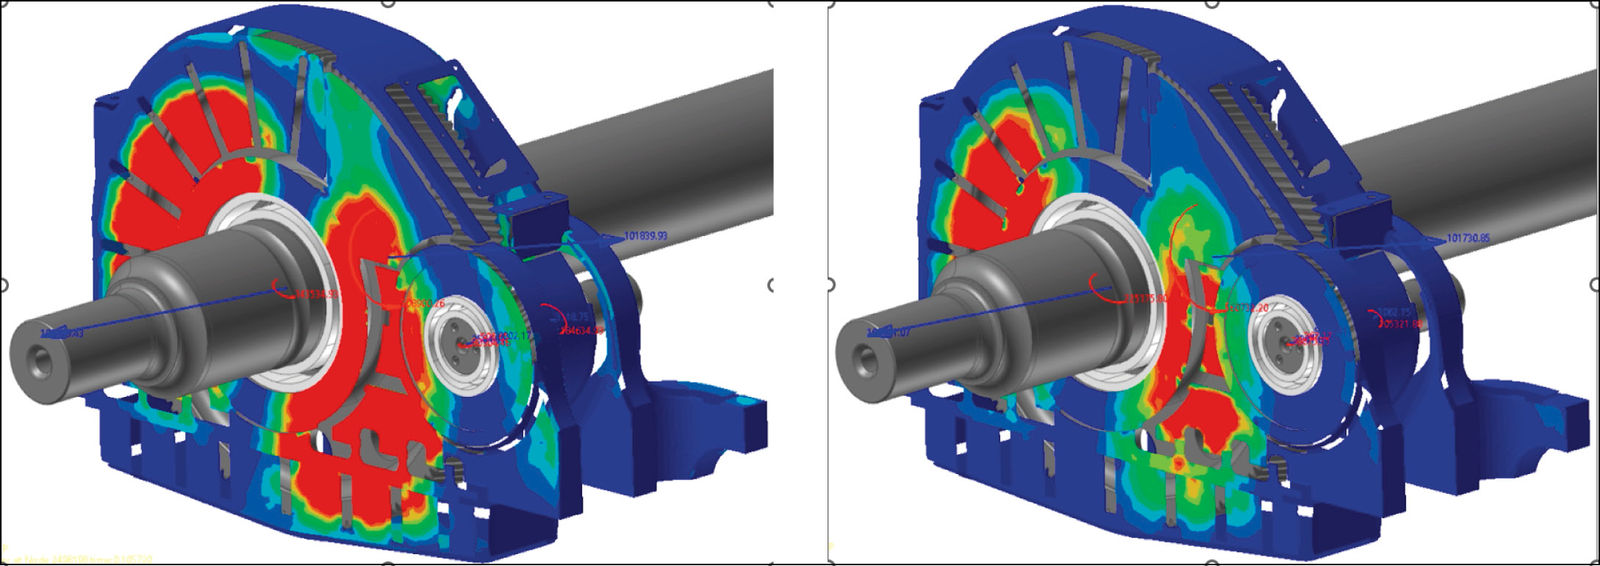
In a final step, the response of the housing in a stage railway gearbox is studied. In a prior step in the project, the original gear macro- and microgeometry was optimized. A forced response analysis was conducted using the gear mesh force variation during the meshing cycle as excitation. The housing response was calculated for both the original and optimized gear macro and micro geometry and the gearbox equivalent radiated power as an indicator for airborne noise was compared. No waviness was applied to the gears.
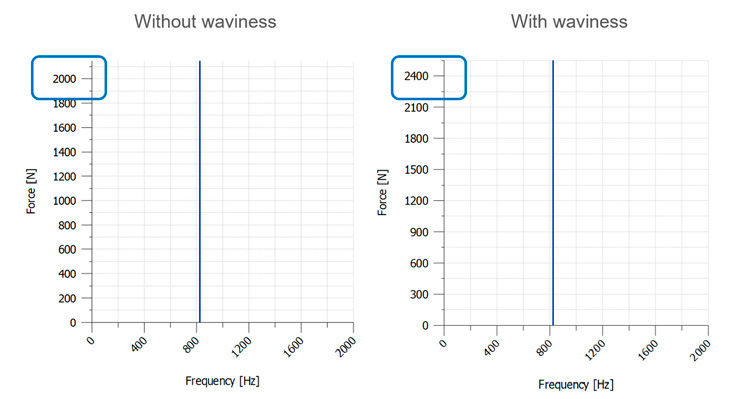
Using the same methodology and tools, the gear mesh force variation was calculated using the optimized gear, once without waviness, once with waviness applied. For this, the LTCA as implemented in KISSsoft was used. For the gear without waviness, the gear mesh force variation was 2,110 N, whereas for the gear having waviness, it was 2,500 N (rounded to 10 N each).
Figure 12—Left column: results without waviness. Middle column: results with waviness, amplitude = reference amplitude. Right column: results with waviness, amplitude = 2 x reference amplitude. First row: Profile modification, superimposition of profile crowning plus waviness. Second row: Contact force over mesh. Third row: Transmission error. Fourth row: Amplitude spectrum of transmission error.
Waviness = 0 x reference value
Waviness = 1 x reference value
Waviness = 2 x reference value
Line load [N/mm]
735
743
749
PPTE [um]
18
19
23
TE, 1st comp. [um]
5.74
6.65
7.56
TE, 2nd comp. [um]
3.53
3.92
4.53
TE, 3rd comp. [um]
2.32
2.10
2.43
TE, 4th comp. [um]
1.38
0.70
0.97
TE, 5th comp. [um]
0.74
1.22
1.03
TE, 6th comp. [um]
0.40
1.24
1.33
Table 1—Numerical values for line load, PPTE and transmission error amplitude spectrum.
Waviness = 0 x reference value
Waviness = 1 x reference value
Waviness = 2 x reference value
Line load [N/mm]
1.00
1.01
1.02
PPTE [um]
1.00
1.06
1.28
TE, 1st comp. [um]
1.00
1.16
1.32
TE, 2nd comp. [um]
1.00
1.11
1.28
TE, 3rd comp. [um]
1.00
0.91
1.05
TE, 4th comp. [um]
1.00
0.51
0.70
TE, 5th comp. [um]
1.00
1.65
1.39
TE, 6th comp. [um]
1.00
3.10
3.33
Table 2—Normalized values for line load, PPTE and transmission error amplitude spectrum.
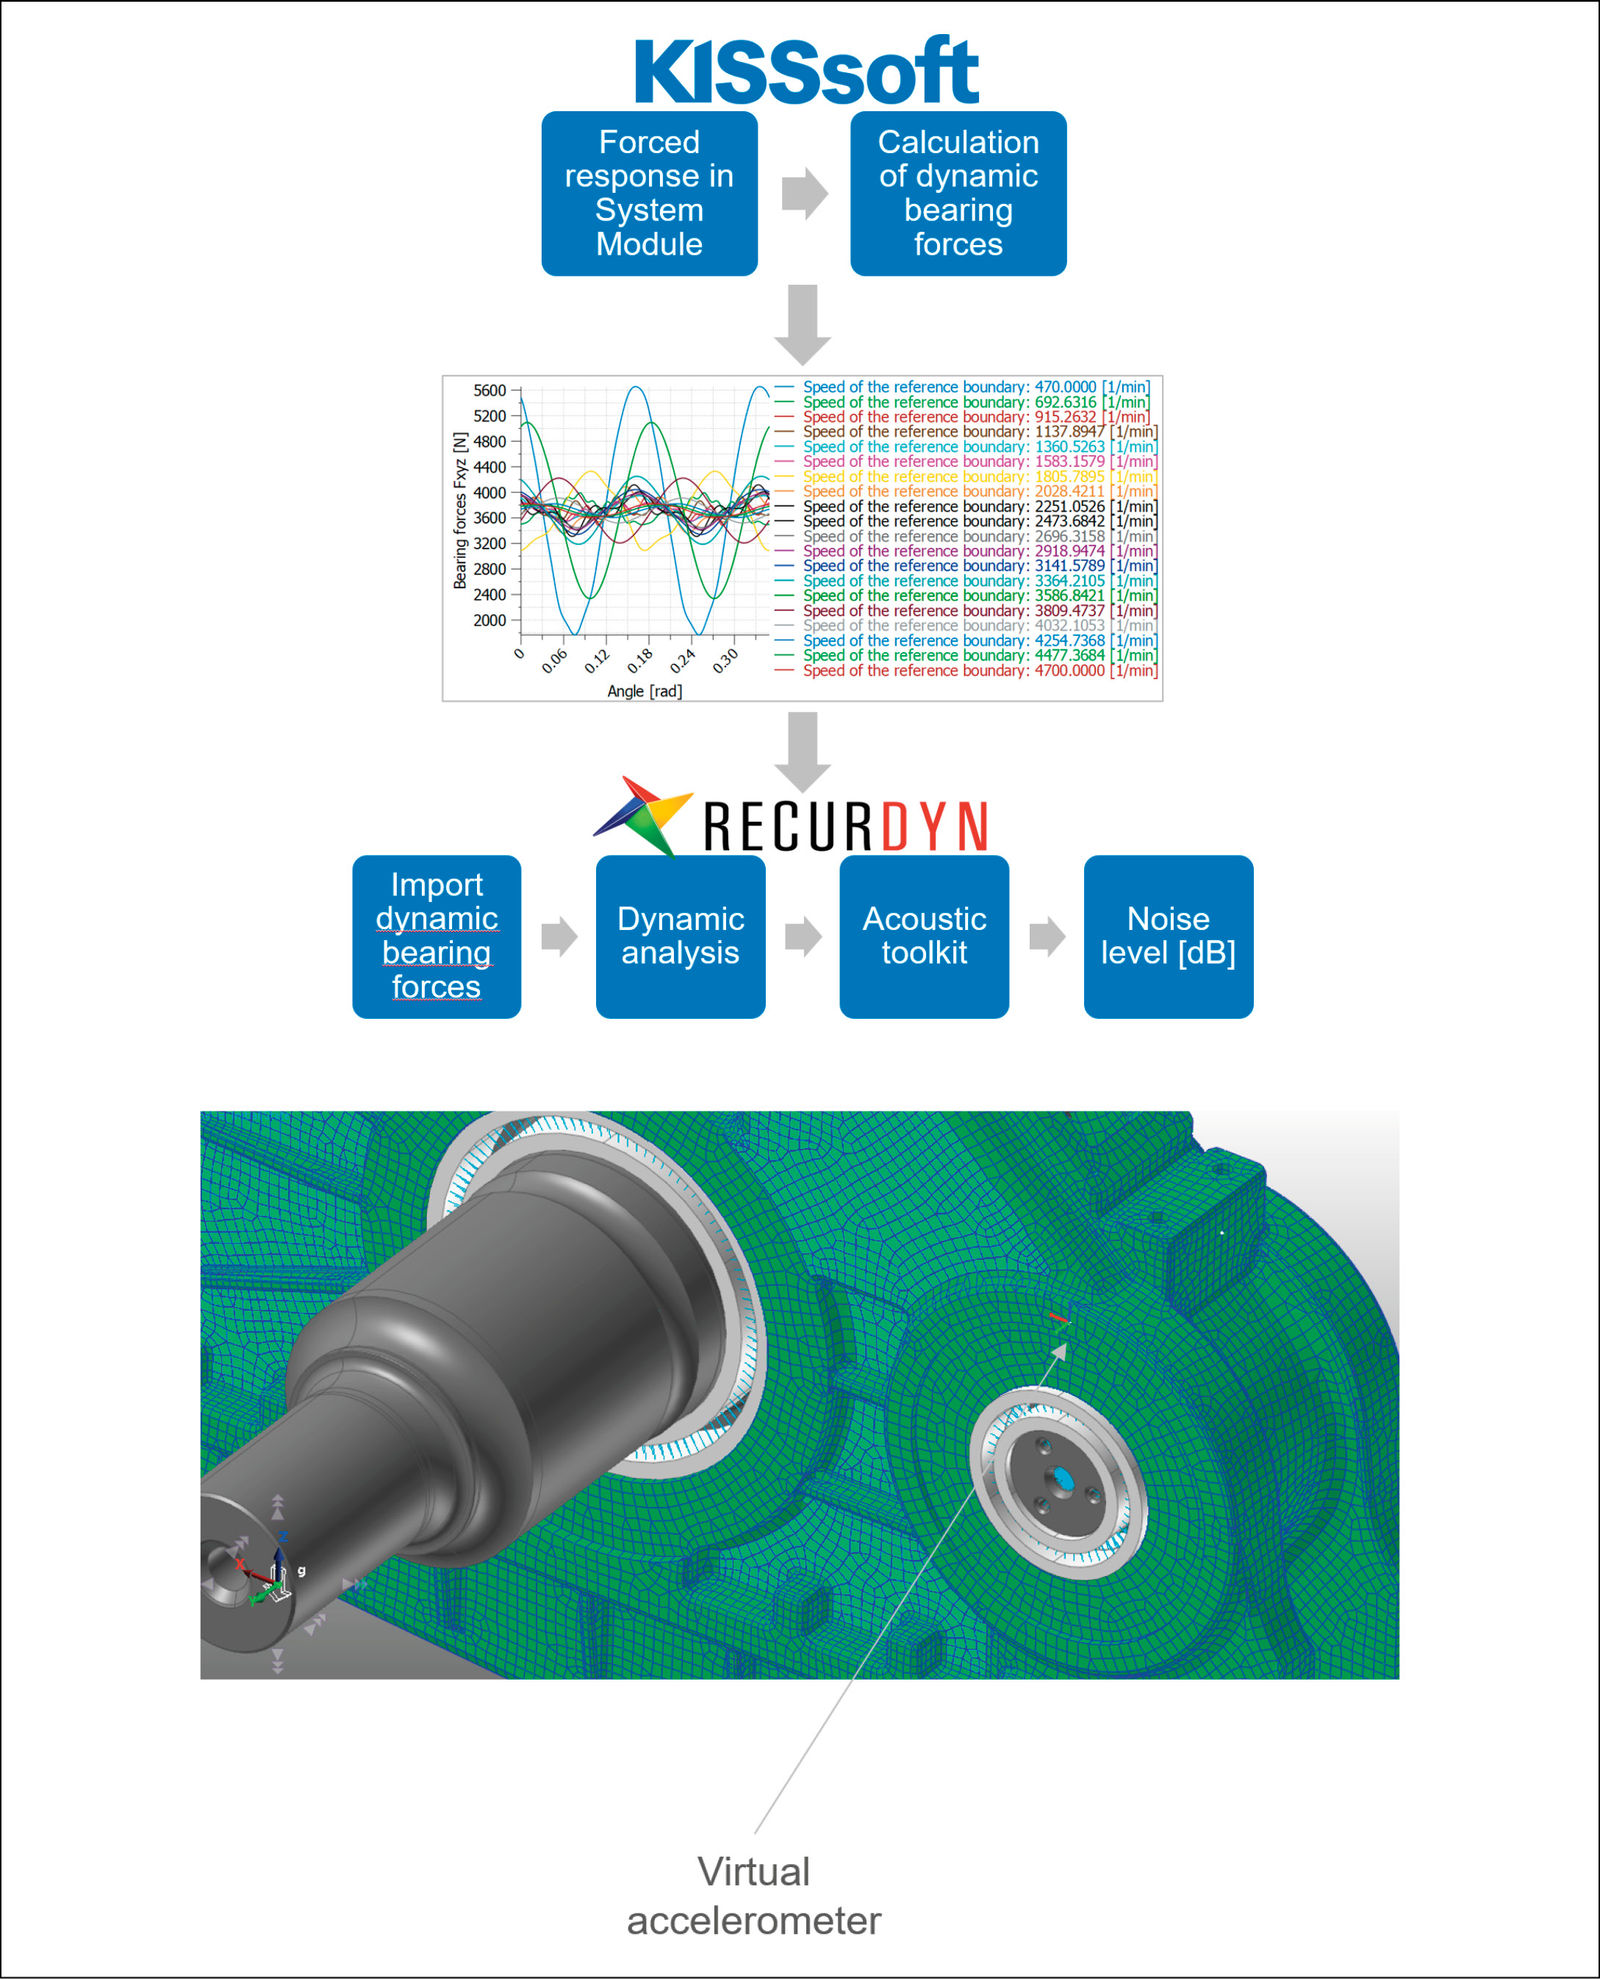
Figure 13—Left: Housing equivalent radiated power for reference gear macro and micro geometry. Right: Housing equivalent radiated power for optimized gear macro and micro geometry. In both cases, no waviness.Figure 14—Left: Gear mesh force, maximum over a pitch, computed through LTCA, for a gear having no waviness defined. Right: For the same gear but having waviness.Figure 15—Left: using KISSsoft to calculate bearing forces in the time domain, RecurDyn to calculate housing excitation therefrom. Right: Virtual accelerometer placed on housing to measure displacement, velocity and acceleration.
The variation in gear mesh force, calculated in the forced response analysis in KISSsoft, resulted in variation of bearing forces as shown on the left side of Figure 15. The bearing forces (in the time domain) are exported from KISSsoft and imported into RecurDyn, where the housing is subjected to dynamic analysis. On the housing, several virtual accelerometers are placed at critical locations and displacement, velocity and acceleration in the nodes where these virtual accelerometers are placed are recorded in the time domain.
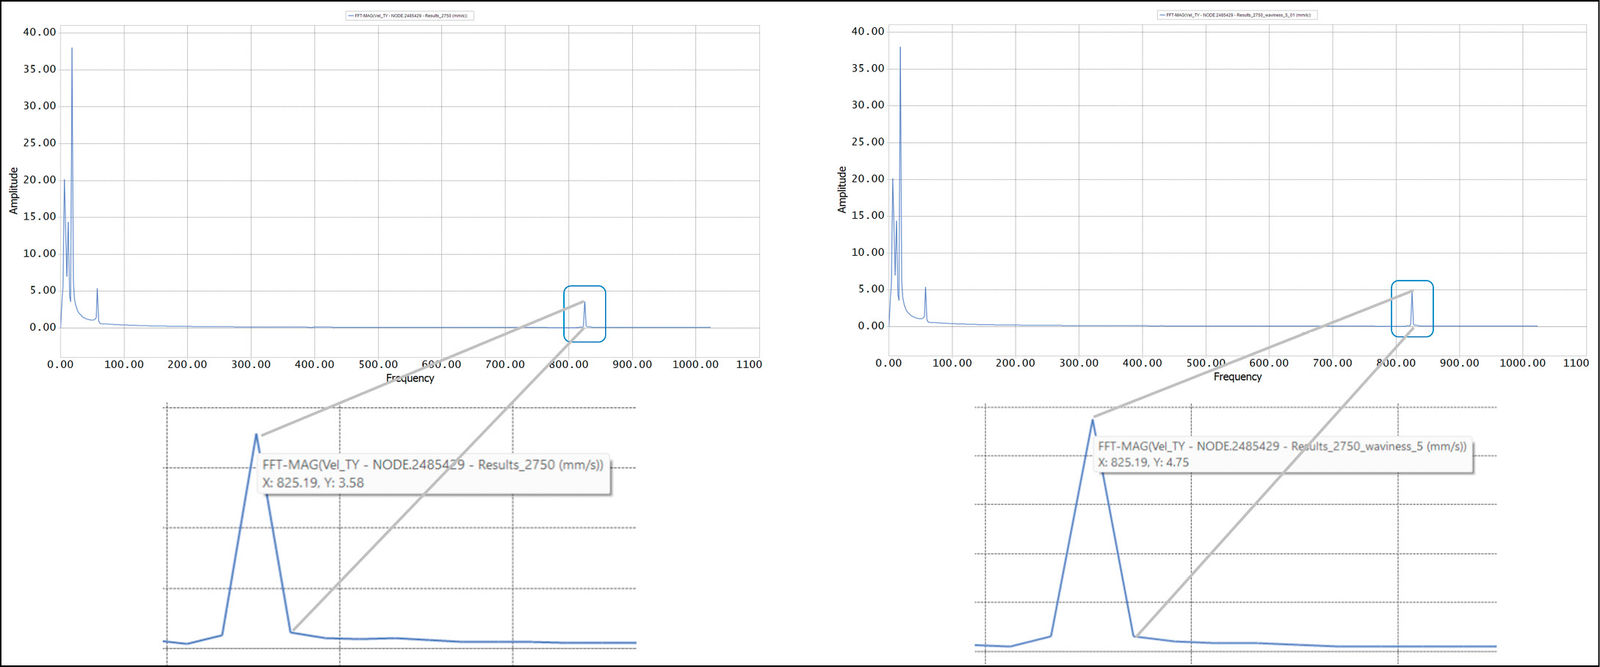
Converting the time domain results by Fourier transformation into a frequency domain result allows for plotting of the e.g., velocity vs. frequency. On the left side of Figure 16, the velocity of the node where the virtual accelerometer is placed is shown for the gear without waviness applied. We see a few peaks at low frequencies and then a peak at the gear mesh frequency of 825Hz. We see the same peak, but at a higher amplitude, for the gear with waviness applied on the right side of Figure 16. The velocity increases from 3.58 m/s to 4.75 m/s, an increase of 33 percent.
With this, we may conclude that the process, methods and tools are likely to be suitable for the assessment and optimization of waviness aiming at a reduced gearbox noise level. Obviously, further work to deepen the understanding of the approach and results is needed. Also, this approach is not automatized and requires experience and engineering judgement for the assessment of results. It is currently suitable for specific projects or troubleshooting, but not for use in quality control of thousands of gears. In sound critical applications where a few units of gears are used, e.g., marine gearboxes, the above process looks promising. It also looks promising for critical applications where many units with consistent manufacturing are manufactured, e.g., for aerospace or EV gearboxes.
Figure 16—Left: Housing velocity at the position of virtual accelerometer, for housing frequency = gear mesh frequency, for gear not having waviness. Right: For gear having waviness.
Further Works
Parametric and Other Studies
These aim at two areas: improvements in the model and tools used. Model improvements include:
Increase the resolution in the digital twin.
Automatic approximation of each trace as measured by superimposition of sinus forms.
Automatic data transfer between KISSsoft and GAMA.
Extend calculation to ERP (equivalent radiated power) as a measure for sound emission from housing as shown on the right, where two macrogeometries are compared (without influence of waviness).
Secondly, in application experience and validation:
Project collaboration with industrial partners or research institutes.
Adapt methods to different types of products.
Extend methodology to bevel gears.
Currently, the authors work on studies to calculate the housing vibration and equivalent radiated power ERP as an indicator for the noise perceived, using parallel shaft gearboxes. In previous works, the influence of optimized gear macro- and microgeometry on the housing vibration has been shown. The calculation process is now adapted and refined, such that the influence of waviness on the housing excitation may be studied.
Patent
The patent WO2023208958A1, filed by KISSsoft AG—A Gleason Company, introduces a method to predict and reduce noise in gear pairs, crucial for improving noise and vibration characteristics in transmissions, especially for electric vehicles. The method focuses on measuring and analyzing deviations in gear tooth flanks by applying the Fourier transformation to pinpoint specific vibration frequencies that contribute to noise. By isolating these critical frequencies, the approach allows for targeted design adjustments, reducing undesirable noise more effectively. The invention also offers flexible analysis, usable with standard testing equipment and adaptable software solutions for practical gear production settings.
This patent describes a novel method for predicting noise emissions in gear pairs, specifically focusing on noise reduction for transmissions, such as those in electric vehicles. When two gears engage, vibrations and noise often arise due to deviations in the tooth flank surfaces, even if the gears meet high-quality standards. These noise issues, termed NVH (Noise, Vibration, and Harshness), are challenging to resolve as they are influenced by multiple factors, including gear accuracy, manufacturing variances, and operational load conditions.
Traditional approaches to predicting gear noise often rely on examining overall deviations between the manufactured tooth flank and an idealized target profile. However, these methods can fail to capture the specific deviations that directly contribute to noise emissions. This invention improves current methods by isolating only specific parts of the surface deviation that have the most significant impact on noise. By transforming these deviations into a “complementary space” (usually through Fourier analysis), the method highlights critical frequency components, making it easier to target problematic vibrations. The Fourier analysis breaks down the tooth surface deviation data into individual frequency components, identifying both “mesh” frequencies (frequencies expected due to gear motion) and “ghost” frequencies (unexpected frequencies with no direct relation to gear movement or geometry). Analyzing these specific frequencies allows for precise adjustments to be made in the design and manufacturing stages, significantly reducing gear noise.
This invention also enables customization based on feedback from real-world noise measurements, such as those conducted in end-of-line tests by manufacturers. For instance, if a specific interference frequency is identified during testing, this method allows engineers to trace back and identify which deviations are likely to cause it. This adaptive capability ensures that noise prediction is not just theoretical but grounded in actual measurements, enhancing reliability and relevance for real transmission systems.
The proposed method can be implemented using standard gear testing machines equipped with contact or non-contact sensors to gather measurement data. The analysis process can be further integrated with software (such as KISSsoft), which handles the load-related contact analysis. As an alternative, some analysis steps can be conducted directly on the testing machine, offering flexibility in how the data is processed. Additionally, this method can be adapted into software or testing devices, providing a range of tools for gear noise analysis and optimization.
Overall, this approach represents a significant advancement in gear design, enabling manufacturers to develop quieter gear systems through detailed analysis and targeted frequency-based interventions. By focusing on specific noise-causing deviations rather than broad surface differences, it allows for a more focused reduction in noise emissions, resulting in longer-lasting, higher-performance gear systems with minimal NVH.
Summary
The paper presents a patented process aimed at representing a manufactured gear as a digital twin. This innovative approach allows for the accessibility of the manufactured gear in calculations, facilitating comparisons with the designed gear.
As a result, the assessment of the manufactured gear can encompass not only geometrical properties, such as the gear quality number, but also performance characteristics, including transmission error and housing excitation. The resolution of the digital twin has been expanded to include not only the macro- and microgeometry of the gear but also flank waviness.
Research has demonstrated that considering flank waviness in the digital twin significantly influences housing vibration. However, further work is necessary to enhance the fidelity of the digital twin by increasing the resolution of the model.
[advertisement]
×
Like What You see?
Power Transmission Engineering is THE magazine of mechanical components. PTE is written for engineers and maintenance pros who specify, purchase and use gears, gear drives, bearings, motors, couplings, clutches, lubrication, seals and all other types of mechanical power transmission and motion control components.
*Unsubscribe any time. Full details in our privacy policy


 Power Transmission Engineering is THE magazine of mechanical components. PTE is written for engineers and maintenance pros who specify, purchase and use gears, gear drives, bearings, motors, couplings, clutches, lubrication, seals and all other types of mechanical power transmission and motion control components.