The rapid advancement of electric vehicles (EVs) has significantly increased the demand for reliable and efficient transmission systems. This has brought the study of gear scuffing to the forefront of research in automotive engineering (Ref. 1). Gear scuffing, a form of surface damage caused by metal-to-metal contact under high load and speed conditions (Ref. 2), poses a substantial challenge to the durability and longevity of EV gearboxes. With pitch line velocities reaching up to 100 m/s (Ref. 3), the risk of scuffing becomes more pronounced, necessitating a deeper understanding and innovative solutions to mitigate this issue.
To address the challenges posed by gear scuffing, researchers have turned to ISO standards (Ref. 4) and advanced analytical software tools (Refs. 5–7]. These tools are designed to predict scuffing failure and evaluate the effectiveness of various mitigation strategies. By simulating the operating conditions of EV gearboxes, these software tools can identify critical factors that contribute to scuffing and suggest design modifications to enhance gearbox durability. The integration of such predictive tools into the design and testing phases of EV transmission systems is crucial for developing more robust and reliable gearboxes, ultimately contributing to the overall performance and sustainability of electric vehicles.
There are two primary categories of analytical software used to predict gear scuffing. The first category includes software based on ISO 6336, such as Masta and KISSsoft (Refs. 5,6). This type of software relies heavily on empirical correlations derived from the ISO 6336 standard, incorporating factors like gear geometry, material properties, lubrication properties and operating conditions. These empirical methods provide a structured approach to understanding gear scuffing by utilizing established standards and correlations.
The second category involves software that utilizes the Elastohydrodynamic Lubrication (EHL) model, with Windows LDP (Ref. 7), developed by the Gear and Power Transmission Research Laboratory at Ohio State University, being a prime example. The EHL model considers the formation of a lubricant film under high pressure and shear conditions, which is crucial for preventing metal-to-metal contact and subsequent scuffing. This physics-based approach accounts for the dynamic behavior of the lubricant film, which might offer a more detailed and accurate prediction of scuffing phenomena compared to empirical methods.
Scuffing largely depends on contact stress. References (Refs. 8,9) benchmarked various software tools, including FE-based gear software like Windows LDP, ISO AGMA-based software like KISSsoft, and general FE software like Abaqus. These tools show no conclusive or consistent results. If general FE software is used as a baseline, Windows LDP can predict up to 20–130 percent higher contact stress than the baseline. KISSsoft shows a similar trend, with deviations up to 200 percent. Even within Windows LDP, different methods based on FEM or BEM can lead to up to a 36 percent difference in maximum contact stress. A similar situation exists for Masta, although there is no paper discussing this. According to its manual (Ref. 6), the Basic LTCA module yields different contact results compared to the Advanced LTCA module. The primary difference lies in whether the solver is ISO-based or FE-based. These variations highlight the challenges in achieving accurate gear scuffing ratings through analytical or numerical methods in the gear industry.
The reason for the differences in results is that gear contact stress from analytical or numerical methods usually falls in the 1GPa to 2GPa range. Current contact stress sensors, such as Fuji contact stress pre-scale film (Ref. 10), are well below this range. Therefore, experimental data can only validate the software based on contact pattern position or surface durability under various assumptions (Ref. 11), but not the actual contact stress value. This also explains why the contact factor of safety (FOS) in ISO standards, or ISO-based software, is empirical.
Recent advancements in analytical tools have significantly improved the accuracy of contact stress and scuffing surface temperature predictions. However, a large margin of error still exists in practical applications. Software ratings often tend to be conservative, leading to overly redundant designs. Consequently, companies must undergo extensive testing and development cycles to establish their in-house databases and correlate these findings with new designs. For surface durability caused by contact stress, companies often rely on software for contact stress analysis but need to perform in-house tests to determine material strength and life cycles, creating a database for future designs. For gear scuffing ratings, often initiated by lubrication suppliers who rate the oil in a standard FZG 4-square machine (Ref. 12,13), gear engineers use the lubrication load stage to rate the gear for scuffing by analytical or numerical methods. The accuracy of these results remains a challenge in the gear industry, often leading to long development cycles or customer test rigs for testing without satisfactory results or reference values for future designs. Essentially, while software provides stress or scuffing surface temperature solutions, users must calibrate the software with in-house experiments for accurate ratings.
The objectives of this paper are as follows:
Establish a controlled macro/micro gear design case in Masta and Windows LDP;
Compare contact pattern, contact stress, and scuffing surface temperature results;
Identify the parameters affecting scuffing results and conduct a parametric study;
Propose a scuffing rating process for the two software packages, which will be able to integrate test rig results to calibrate the software.
Methodology
To make an apple-to-apple comparison between Windows LDP and Masta, the following strategy is employed:
Gear Design: Use gears with the same macrogeometry and symmetrical microgeometry in the lead direction to avoid potential modeling errors. The modifications should be just enough to prevent any edge contact, which could lead to inaccuracies or singularities in the contact stress results.
Misalignment: No misalignment input for Windows LDP, ensuring no system deflection. Achieve no misalignment in Masta by using a very stiff shaft and concept bearing, making system deflection negligible.
Lubrication Model and Temperature: Set up the lubrication model and system temperature identically in both software to ensure consistency.
[advertisement]
This approach ensures an accurate and fair comparison between the two software tools. Several parameters are known to affect gear scuffing, and four have been chosen for parametric study:
Surface Roughness: Smoother surfaces reduce the risk of scuffing by promoting better lubricant film formation.
Torque Load: Higher loads increase the risk of scuffing due to higher contact stress.
Speed: Higher speeds can lead to increased frictional heating and reduced lubricant film thickness.
Lubrication Selection: Different lubricants have varying scuffing resistance properties, influenced by their viscosity, additive package, and thermal stability.
It is known that scuffing is a complex phenomenon resulting from the coupled effects of these parameters (Ref. 1). For example, the lubrication properties will interact with the contact stress. They are not directly considered in the input stage but rely on the software solver. The lubrication spraying into or out of meshing, nozzle configuration, and lubrication flow rate are also not considered in the software comparison study.
Case Study and Results Discussion
Table 1 is the gear parameter table for the case study. The gear size is typical for the second stage in a passenger car EDU. The nominal operating load for the gear is 1,260 Nm, max speed is 2,500 RPM, the surface roughness is Rz = 0.4 µm, with ISO VG 460 lubrication, at a sump temperature of 85°C. Table 2 summarizes the range for the parametric study.
Name
Pinion
Wheel
Number of Teeth
25
78
Normal Module (mm)
2.662
Normal Pressure Angle (°)
17.5
Helix Angle (°)
19.8
Hand
Right
Left
Tip Diameter (mm)
77.1
224
Root Diameter (mm)
62.07
208.617
Profile Crowning Relief (µm)
20
0
Lead Barreling Relief (µm)
50
20
Table 1—Gear parameters for the case study.
Surface Roughness Rz (µm)
Torque (N*m)
Speed (RPM)
Lubrication
0.1
630
1250
75W90
0.4
945
2500
ISO VG 460
2
1260
3750
1575
5000
1890
6250
Table 2—Parameter range.
The parametric study is conducted by varying one parameter at a time, with other values at nominal values underlined in the table. Windows LDP uses Rq = 0.22*Rz for surface roughness.
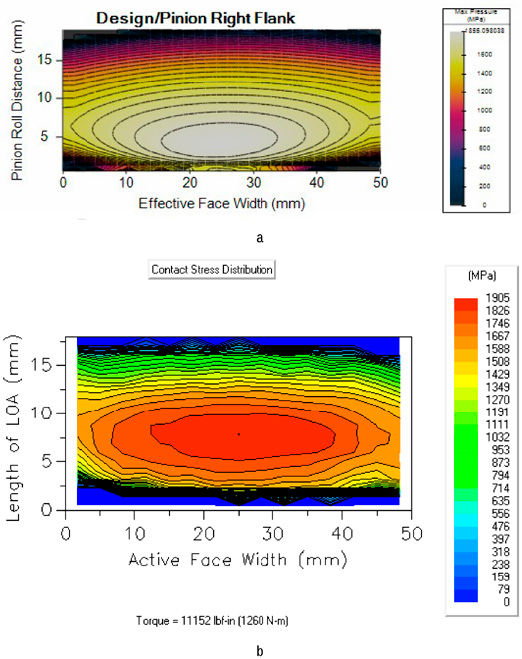
The contact stress results for the nominal load case are shown in Figure 1. There are noticeable differences in contact pattern position, with Masta’s contact pattern position lower than Windows LDP. The max contact stress in Masta is three percent lower than in Windows LDP.
Figure 1—Contact stress contour for nominal load: a) Masta, b) Windows LDP.
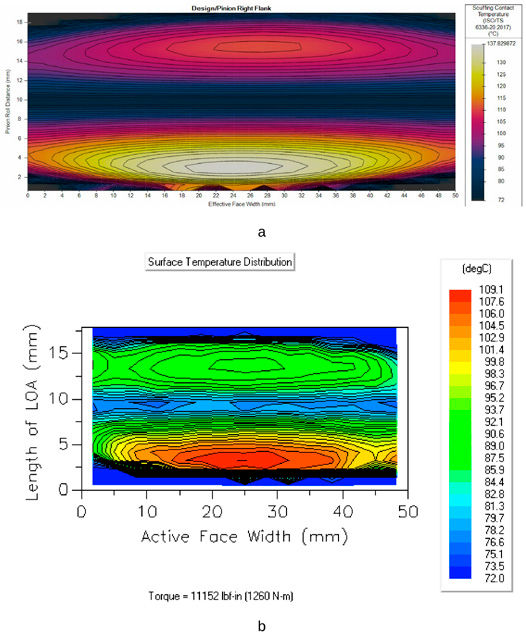
Scuffing surface temperature results are used in both software for scuffing rating. Masta uses flash temperature. Windows LDP uses temperature calculated analytically based on physics. Both temperatures cannot be verified by physical measurement. Figure 2 shows the nominal case results.
Figure 2—Surface temperature contour for nominal load: a) Masta, b) Windows LDP.
The pitch has the lowest temperature due to zero sliding velocity. Each software predicts the highest scuffing surface temperature below the pitch line toward the pinion root. Masta’s max scuffing surface temperature is 20 percent higher than Windows LDP.
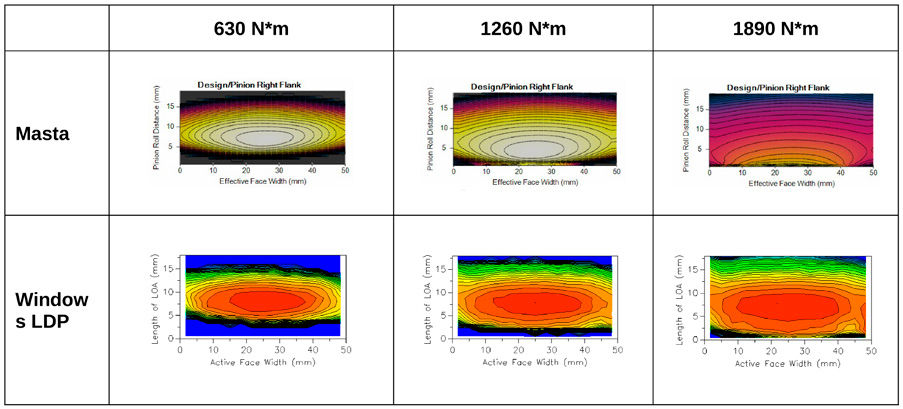
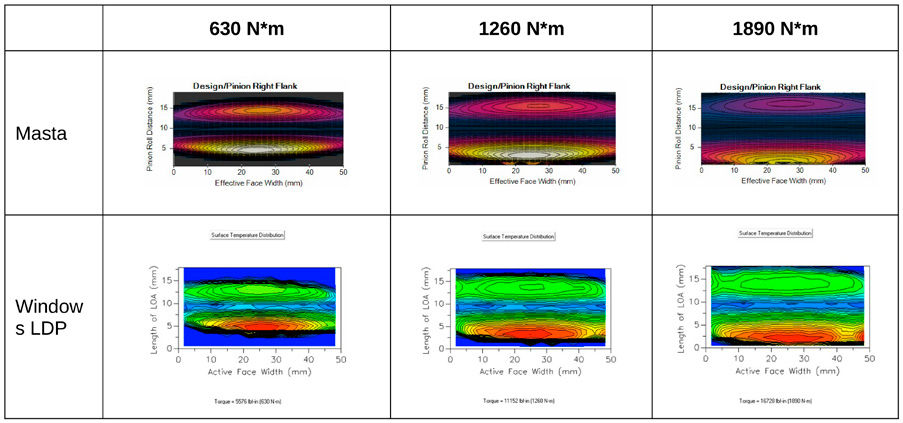
The contact stress and scuffing surface temperature contours under different load conditions are summarized in Table 3 and Table 4.
Table 3—Contact pattern at various torques.Table 4—Surface temperature at various torques.
When torque increases, the contact pattern on the pinion spreads larger and shifts toward the pinion root. Both software predict a similar trend. However, Masta predicts edge contact at high torque, which is not reflected in Windows LDP. The tooth bending model in Masta is based on the Lewes bending assumption used in ISO standards, while Windows LDP uses an FE-based solver. Detailed discussion can be found in Refs. 8,9. The scuffing surface temperature results are largely based on the contact stress distribution. Masta scuffing surface temperature result is 40 percent higher than Windows LDP at high torque, compared with 11 percent at low torque.
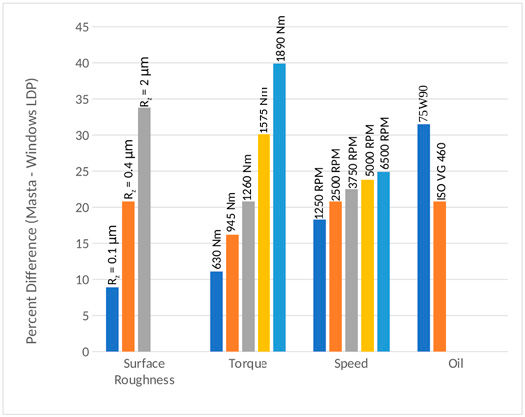
The parametric results summary is shown in Figure 3.
Figure 3—Parametric study result summary.
Masta scuffing surface temperature solution is consistently higher than the Windows LDP prediction, with the percentage deviation varying across different parameters. As surface roughness increases from 0.1 µm to 2 µm, the deviation rises from eight percent to 34 percent. Similarly, torque increases from 630 N*m to 1,890 N*m, resulting in a deviation growth from 11 percent to 40 percent. Speed changes from 1,250 RPM to 6,500 RPM lead to a deviation shift from 18 percent to 25 percent. Regarding lubrication, 75W90 shows a 32 percent deviation, while ISOVG460 has a 21 percent deviation.
Testing Method
Physical testing for gear scuffing is a standalone activity and does not need to be correlated with scuffing analytical software. However, if the sample is not well analyzed in relation to the test rig’s capacity, the rig may lack sufficient RPM, torque, or power to cause the expected scuffing failure. Additionally, the stiffness of the test rig components, such as bearings and shafts, can affect the test results.
Therefore, a dual approach is needed for physical testing. The system model in Masta should be used to assess the sample-test rig requirements to ensure the test leads to the intended scuffing results.
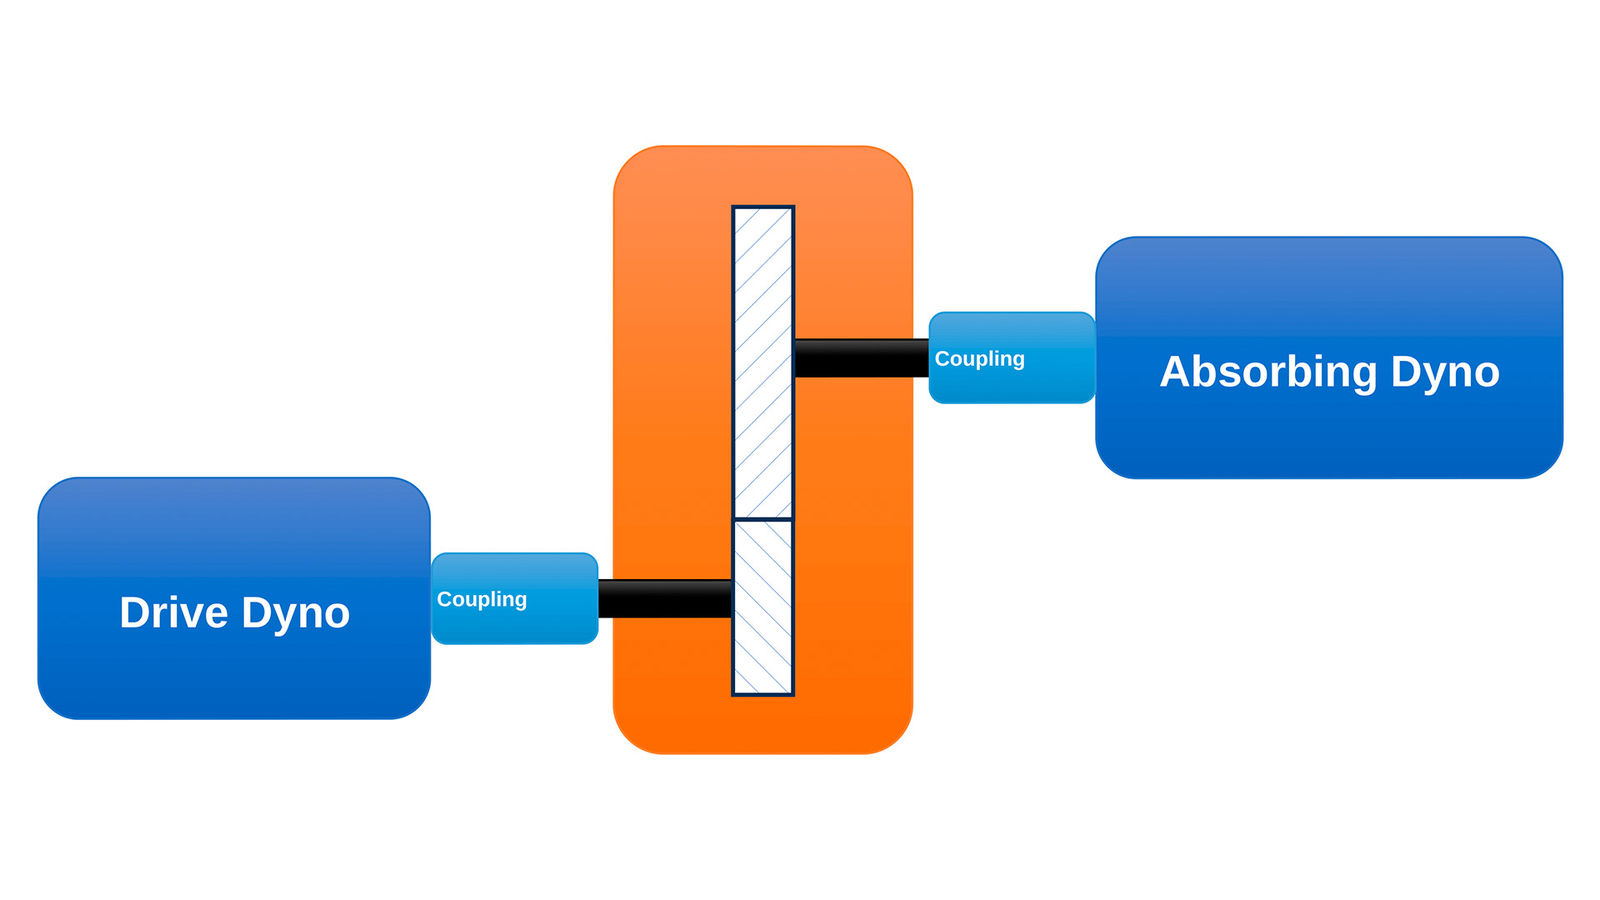
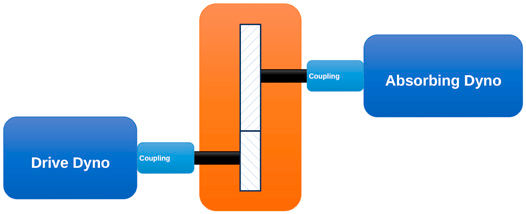
Figure 4 shows the layout for the testing dyno, which uses two dynos for driving and loading. Compared to the four-square layout (Refs. 12,13), each test takes less time to set up, and the torque and RPM of the testing are not affected by the test rig’s secondary gear pair.
Figure 4—Test rig layout.
The selected gears are tested by loading them stepwise in five stages, operating for 15 minutes at each load stage while maintaining the assigned pitch line velocity and an initial lubrication temperature of 85°C. The lubrication nozzle type, diameter, jet type and nozzle position can be altered, allowing control over lubrication flow rate and lubrication starvation, which is not directly reflected in the analytical software. The analytical software assumes sufficient lubrication, but the data can be fed into the software calibration database for that specific lubrication condition.
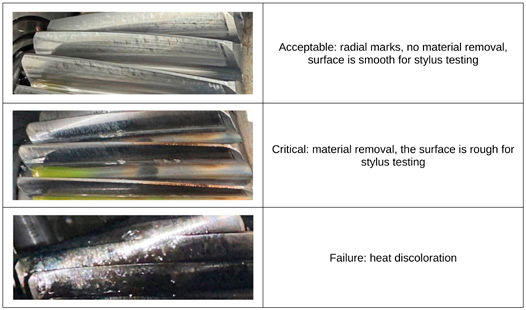
After each load stage, the gear flanks are visually inspected for scuffing marks. The failure load stage is identified when the gears reach a critical condition or failure, as listed in Table 5. Exit lubrication temperature and test rig vibration can be monitored to help identify the occurrence of scuffing failure.
Table 5—Scuffing visual assessment guide.
Software Correlation and Scuffing Rating
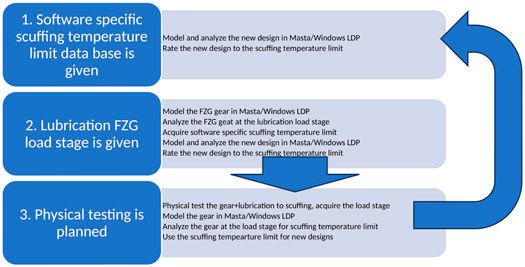
To use either Masta or Windows LDP for scuffing rating, the process shown in Figure 5 is proposed. In most applications, the lubrication FZG stage is provided at the initial design stage. Method 2 can be used to obtain initial results for the scuffing rating. Scuffing is a phenomenon resulting from gear-lubrication interaction. The new gear design will exhibit different scuffing performance compared to standard FZG gears. Method 3 can be employed as a validation or correction for the analytical solution. Subsequently, the data can be fed into a scuffing surface temperature limit database. A key takeaway from this research is that the database is software-specific and cannot be transferred between different software due to the use of different solvers based on varying theories.
Figure 5—Software correlation and scuffing rating process.
Conclusion
This study provides a comprehensive comparison between Windows LDP and Masta for evaluating gear scuffing performance. Key findings include:
Using identical macrogeometry and symmetrical microgeometry ensures accurate modeling and comparison. The two software predict different contact stress and pattern positions, especially at high torque, which contributes to the scuffing result differences.
A parametric study was conducted, including the impact of torque and speed, surface roughness, and lubrication. There is up to a 40 percent deviation between the software.
Differences in solver methodologies between Masta and Windows LDP result in varying predictions, emphasizing the need for software-specific calibration and validation.
Methodology for calibrating the software with physical testing and testing methods.
Despite a large amount of research in analytical solutions for scuffing, physical testing is still required. The results of the paper provide guidelines for scuffing rating.
References
T. Chen, C. Zhu, J. Chen, and H. Liu, “A review on gear scuffing studies: Theories, experiments and design,” Tribology International, Vol. 109741, 2024.
S. Li and A. Kahraman, “A scuffing model for spur gear contacts,” Mechanism and Machine Theory, Vol. 156, pp. 104161, 2021.
J. Vorgerd, P. J. Tenberge, and M. Joop, “Scuffing of cylindrical gears with pitch line velocities up to 100 m/s,” 2021.
ISO/TS 6336, Calculation of load capacity of spur and helical gears.
KISSsoft, [Online]. Available: kisssoft.com
SmartMT, [Online]. Available: smartmt.com/masta
GearLab, [Online]. Available: mae.osu.edu/gearlab
F. Bejar, J. Perret-Liaudet, O. Bareille, M. Ichchou, and M. Fontana, “Review and benchmarking study of different gear contact analysis software in terms of the static transmission error response,” Results in Engineering, Vol. 22, pp. 102286, 2024.
M. A. Adnan and A. Shehata, “Stress Analysis Validation for Gear Design,” 2018.
S. Vijayakar, Contact and Bending Durability Calculation for Spiral-Bevel Gears, No. GRC-E-DAA-TN31732, 2016.
D. J. Hargreaves and A. Planitz, “Assessing the energy efficiency of gear oils via the FZG test machine,” Tribology International, Vol. 42, No. 6, pp. 918–925, 2009.
Symbrium, [Online]. Available: symbrium.com
First presented at the 2025 Fall Technical Meeting (FTM), October 22–24, 2025, Detroit, and printed with permission of the author(s). Statements presented in this paper are those of the author(s) and may not represent the position or opinion of the American Gear Manufacturers Association.
[advertisement]
×
Like What You see?
Power Transmission Engineering is THE magazine of mechanical components. PTE is written for engineers and maintenance pros who specify, purchase and use gears, gear drives, bearings, motors, couplings, clutches, lubrication, seals and all other types of mechanical power transmission and motion control components.
*Unsubscribe any time. Full details in our privacy policy











 Power Transmission Engineering is THE magazine of mechanical components. PTE is written for engineers and maintenance pros who specify, purchase and use gears, gear drives, bearings, motors, couplings, clutches, lubrication, seals and all other types of mechanical power transmission and motion control components.